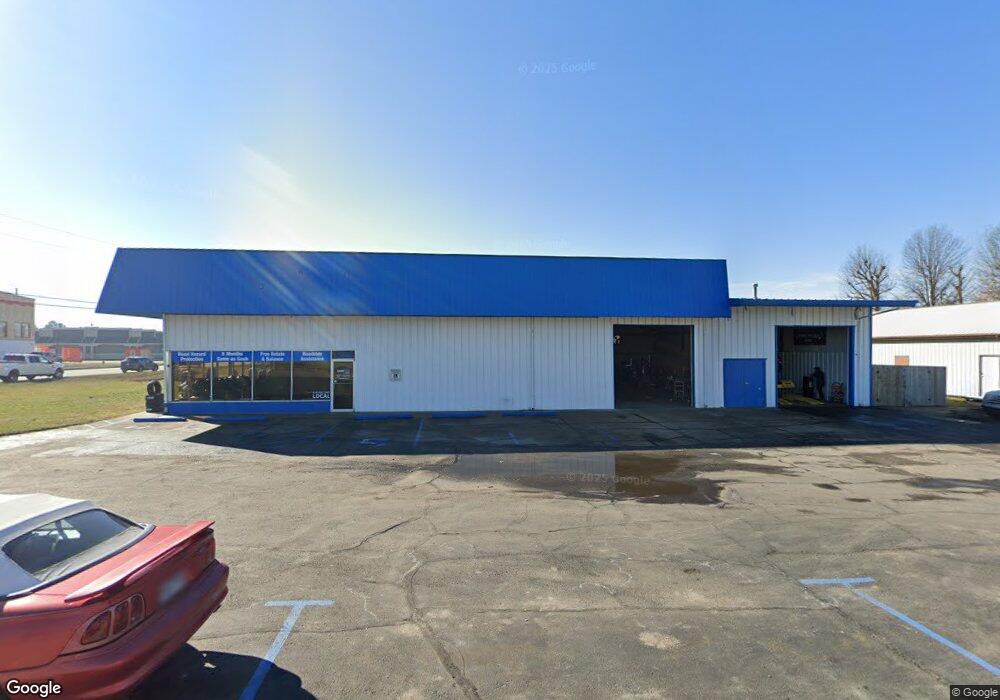
2212 S 8th St Rogers, AR 72758
Estimated Value: $830,746
--
Bed
--
Bath
8,000
Sq Ft
$104/Sq Ft
Est. Value
About This Home
This home is located at 2212 S 8th St, Rogers, AR 72758 and is currently estimated at $830,746, approximately $103 per square foot. 2212 S 8th St is a home located in Benton County with nearby schools including Elza R. Tucker Elementary School, Elmwood Middle School, and Rogers High School.
Ownership History
Date
Name
Owned For
Owner Type
Purchase Details
Closed on
Dec 15, 2011
Sold by
Arvest Trust Company National Associatio
Bought by
Arvest Trust Company National Associatio
Current Estimated Value
Purchase Details
Closed on
Feb 23, 2011
Sold by
Berry David A and Berry Lisa L
Bought by
Ward Ronald E and Ward Jean E
Purchase Details
Closed on
Sep 28, 2004
Bought by
Berry Trust
Purchase Details
Closed on
Sep 1, 2004
Bought by
Berry Joint Rev Trust
Purchase Details
Closed on
Apr 26, 2002
Bought by
Berry
Purchase Details
Closed on
May 4, 1994
Bought by
Ward
Purchase Details
Closed on
Dec 30, 1993
Bought by
Ward
Purchase Details
Closed on
Jul 1, 1984
Bought by
Smith
Create a Home Valuation Report for This Property
The Home Valuation Report is an in-depth analysis detailing your home's value as well as a comparison with similar homes in the area
Home Values in the Area
Average Home Value in this Area
Purchase History
| Date | Buyer | Sale Price | Title Company |
|---|---|---|---|
| Arvest Trust Company National Associatio | -- | None Available | |
| Ward Ronald E | -- | None Available | |
| Berry Trust | -- | -- | |
| Berry Joint Rev Trust | -- | -- | |
| Berry Trust | -- | -- | |
| Berry | $375,000 | -- | |
| Ward | -- | -- | |
| Ward | $36,700 | -- | |
| Smith | $180,000 | -- |
Source: Public Records
Tax History Compared to Growth
Tax History
| Year | Tax Paid | Tax Assessment Tax Assessment Total Assessment is a certain percentage of the fair market value that is determined by local assessors to be the total taxable value of land and additions on the property. | Land | Improvement |
|---|---|---|---|---|
| 2025 | $1,313 | $27,778 | $8,625 | $19,153 |
| 2024 | $1,174 | $27,778 | $8,625 | $19,153 |
| 2023 | $1,068 | $20,180 | $8,350 | $11,830 |
| 2022 | $1,110 | $20,180 | $8,350 | $11,830 |
| 2021 | $1,107 | $20,180 | $8,350 | $11,830 |
| 2020 | $1,154 | $21,020 | $9,330 | $11,690 |
| 2019 | $1,154 | $21,020 | $9,330 | $11,690 |
| 2018 | $1,154 | $21,020 | $9,330 | $11,690 |
| 2017 | $1,091 | $21,020 | $9,330 | $11,690 |
| 2016 | $1,091 | $21,020 | $9,330 | $11,690 |
| 2015 | $1,130 | $21,370 | $10,450 | $10,920 |
| 2014 | $1,130 | $21,370 | $10,450 | $10,920 |
Source: Public Records
Map
Nearby Homes
- 906 W Geneva St
- 2221 S 9th St
- 1100 W Banz Rd
- 1003 W Price Ln
- 1101 W Price Ln
- 2006 S 11th St
- 9.02 Acres W Dyke Rd
- 1303 W Banz Rd
- 2600 Bonnie Ln
- 2610 Bonnie Ln
- 2601 Bonnie Ln
- 2602 Bonnie Ln
- 2605 Bonnie Ln
- 2609 Bonnie Ln
- 2607 Bonnie Ln
- 2603 Bonnie Ln
- 2608 Bonnie Ln
- 2604 Bonnie Ln
- 2606 Bonnie Ln
- 2011 S 13th St
- 852 W Banz Rd
- 852 W Banz Rd Unit 9
- 856 Banz Rd
- 852 & 854 & 856 W Banz Rd
- 852 W Banz Rd
- 852, 854, 856 Banz Rd
- 2210 S 8th St
- 849 W Callahan Dr
- 2300 S 8th St
- 851,853,855 W Banz Rd
- 851 W Banz Rd
- 904 W Banz Rd
- 904 & 906 & 908 W Banz Rd
- 904/6/8 W Banz Rd
- 904, 906, 908 W Banz Rd
- 906 W Banz Rd
- 2406 S 8th St
- 907 W Callahan Dr
- 2301 S 8th Str St
- 2301 S S 8th St