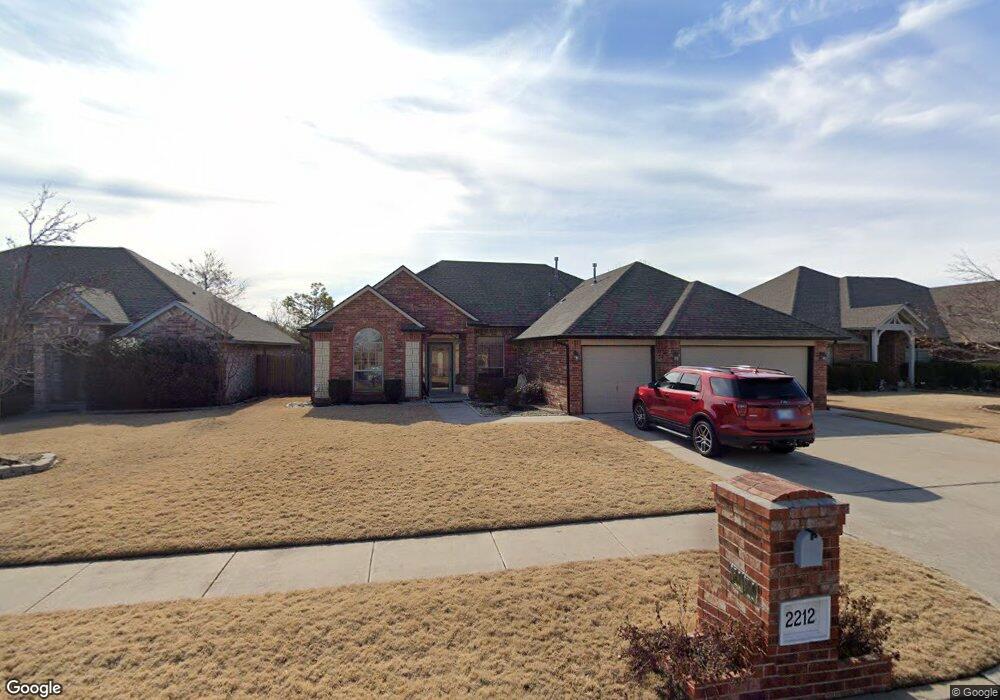
2212 SW 30th St Moore, OK 73170
Oakridge-Southmoore NeighborhoodEstimated Value: $306,000 - $325,000
3
Beds
2
Baths
2,099
Sq Ft
$150/Sq Ft
Est. Value
About This Home
This home is located at 2212 SW 30th St, Moore, OK 73170 and is currently estimated at $315,176, approximately $150 per square foot. 2212 SW 30th St is a home located in Cleveland County with nearby schools including Oakridge Elementary School, Southmoore High School, and St. John's Lutheran School.
Ownership History
Date
Name
Owned For
Owner Type
Purchase Details
Closed on
Jun 29, 2012
Sold by
Kibe Dan Masao and Kibe Nikkitti Lynn
Bought by
Marcoux David and Corrales June M
Current Estimated Value
Home Financials for this Owner
Home Financials are based on the most recent Mortgage that was taken out on this home.
Original Mortgage
$186,459
Outstanding Balance
$129,560
Interest Rate
3.81%
Mortgage Type
FHA
Estimated Equity
$185,616
Purchase Details
Closed on
Apr 23, 2010
Sold by
Townley Jamie and Brookings Shbrone
Bought by
Kibe Dan Masao and Kibe Nikkitti Lynn
Home Financials for this Owner
Home Financials are based on the most recent Mortgage that was taken out on this home.
Original Mortgage
$112,000
Interest Rate
4.88%
Mortgage Type
New Conventional
Purchase Details
Closed on
Dec 3, 2002
Sold by
Tha Development, Inc
Bought by
Harper, Blake Dba Kyle, B Homes
Create a Home Valuation Report for This Property
The Home Valuation Report is an in-depth analysis detailing your home's value as well as a comparison with similar homes in the area
Home Values in the Area
Average Home Value in this Area
Purchase History
| Date | Buyer | Sale Price | Title Company |
|---|---|---|---|
| Marcoux David | $190,000 | The Oklahoma City Abstract & | |
| Kibe Dan Masao | $187,000 | Ort | |
| Harper, Blake Dba Kyle, B Homes | $24,500 | -- |
Source: Public Records
Mortgage History
| Date | Status | Borrower | Loan Amount |
|---|---|---|---|
| Open | Marcoux David | $186,459 | |
| Previous Owner | Kibe Dan Masao | $112,000 |
Source: Public Records
Tax History Compared to Growth
Tax History
| Year | Tax Paid | Tax Assessment Tax Assessment Total Assessment is a certain percentage of the fair market value that is determined by local assessors to be the total taxable value of land and additions on the property. | Land | Improvement |
|---|---|---|---|---|
| 2024 | $3,310 | $27,283 | $5,034 | $22,249 |
| 2023 | $3,166 | $25,984 | $4,834 | $21,150 |
| 2022 | $3,061 | $24,747 | $4,600 | $20,147 |
| 2021 | $2,929 | $23,568 | $4,124 | $19,444 |
| 2020 | $2,791 | $22,446 | $3,360 | $19,086 |
| 2019 | $2,841 | $22,446 | $3,360 | $19,086 |
| 2018 | $2,843 | $22,447 | $3,360 | $19,087 |
| 2017 | $2,858 | $22,447 | $0 | $0 |
| 2016 | $2,878 | $22,447 | $3,360 | $19,087 |
| 2015 | $2,619 | $22,576 | $3,360 | $19,216 |
| 2014 | $2,620 | $22,059 | $2,899 | $19,160 |
Source: Public Records
Map
Nearby Homes
- 1414 SW Sw 24 St
- 708 SW 157th St
- 2508 Tyler Ln
- 2401 Lakecrest Dr
- 1413 SW 161st St
- 1745 SW 31st Terrace
- 720 SW 155th Place
- 404 SW 170th Terrace
- 1011 SW 22nd St
- 1741 SW 33rd St
- 16901 Picasso Dr
- 624 SW 153rd St
- 15600 Sandstone Terrace
- 3901 Sorano Dr
- 2127 Lonnie Ln
- 15500 Sandstone Terrace
- 3909 Sorano Dr
- 2130 Meench Dr
- 300 SW 171st St
- 308 SW 171st St