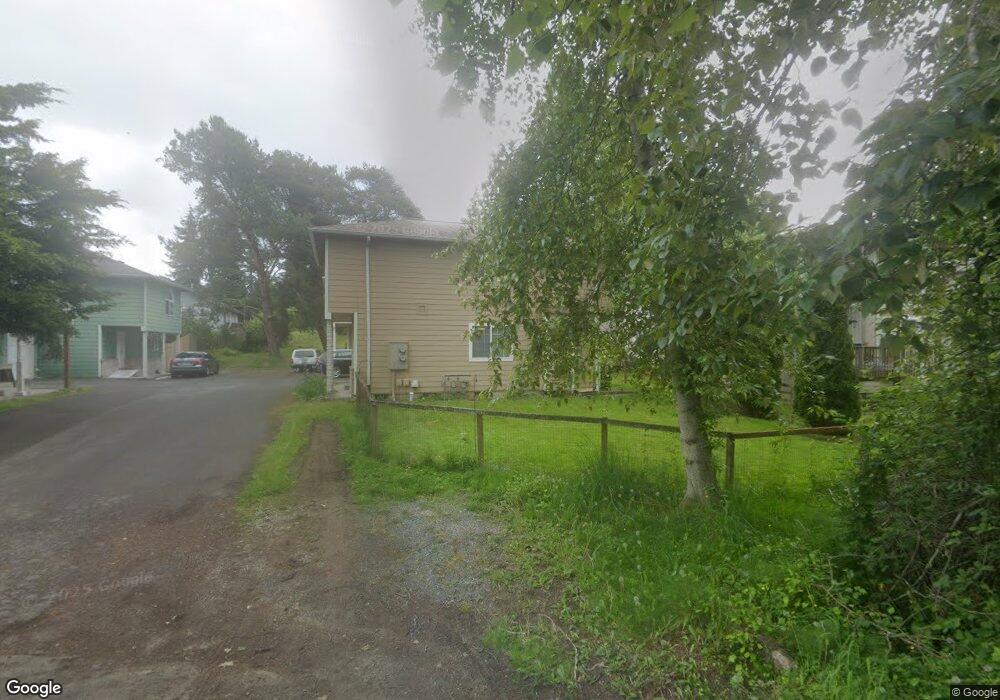
2212 Xenia St Bellingham, WA 98229
Roosevelt NeighborhoodEstimated Value: $742,000 - $835,000
3
Beds
2
Baths
2,507
Sq Ft
$311/Sq Ft
Est. Value
About This Home
This home is located at 2212 Xenia St, Bellingham, WA 98229 and is currently estimated at $780,301, approximately $311 per square foot. 2212 Xenia St is a home located in Whatcom County with nearby schools including Roosevelt Elementary School, Kulshan Middle School, and Bellingham High School.
Ownership History
Date
Name
Owned For
Owner Type
Purchase Details
Closed on
Apr 28, 2005
Sold by
Thames Bruce G and Thames Merriann E
Bought by
Roosma Raymond L and Roosma Karla R
Current Estimated Value
Home Financials for this Owner
Home Financials are based on the most recent Mortgage that was taken out on this home.
Original Mortgage
$246,750
Outstanding Balance
$129,318
Interest Rate
5.92%
Mortgage Type
Fannie Mae Freddie Mac
Estimated Equity
$650,983
Purchase Details
Closed on
Jun 28, 2002
Sold by
Provident Bank
Bought by
Thames Bruce G and Lemas Merriann E
Home Financials for this Owner
Home Financials are based on the most recent Mortgage that was taken out on this home.
Original Mortgage
$189,050
Interest Rate
6.86%
Purchase Details
Closed on
Dec 28, 2001
Sold by
Rohrs Julie L
Bought by
Provident Bank
Purchase Details
Closed on
Apr 24, 2000
Sold by
Page Lawrence N
Bought by
Rohrs Julie L
Home Financials for this Owner
Home Financials are based on the most recent Mortgage that was taken out on this home.
Original Mortgage
$199,750
Interest Rate
7.86%
Create a Home Valuation Report for This Property
The Home Valuation Report is an in-depth analysis detailing your home's value as well as a comparison with similar homes in the area
Home Values in the Area
Average Home Value in this Area
Purchase History
| Date | Buyer | Sale Price | Title Company |
|---|---|---|---|
| Roosma Raymond L | $329,000 | First American Title Insuran | |
| Thames Bruce G | $199,000 | First American Title Insuran | |
| Provident Bank | $199,000 | First American Title Insuran | |
| Rohrs Julie L | $235,000 | Island Title |
Source: Public Records
Mortgage History
| Date | Status | Borrower | Loan Amount |
|---|---|---|---|
| Open | Roosma Raymond L | $246,750 | |
| Previous Owner | Thames Bruce G | $189,050 | |
| Previous Owner | Rohrs Julie L | $199,750 |
Source: Public Records
Tax History Compared to Growth
Tax History
| Year | Tax Paid | Tax Assessment Tax Assessment Total Assessment is a certain percentage of the fair market value that is determined by local assessors to be the total taxable value of land and additions on the property. | Land | Improvement |
|---|---|---|---|---|
| 2024 | $5,765 | $722,447 | $238,607 | $483,840 |
| 2023 | $5,765 | $740,797 | $244,668 | $496,129 |
| 2022 | $4,708 | $638,629 | $210,924 | $427,705 |
| 2021 | $4,619 | $506,848 | $167,400 | $339,448 |
| 2020 | $4,253 | $469,304 | $155,000 | $314,304 |
| 2019 | $3,807 | $417,671 | $124,778 | $292,893 |
| 2018 | $3,834 | $374,908 | $112,028 | $262,880 |
| 2017 | $3,309 | $322,785 | $96,450 | $226,335 |
| 2016 | $2,895 | $291,169 | $86,550 | $204,619 |
| 2015 | $2,838 | $265,132 | $79,050 | $186,082 |
| 2014 | -- | $251,548 | $75,000 | $176,548 |
| 2013 | -- | $248,450 | $73,500 | $174,950 |
Source: Public Records
Map
Nearby Homes
- 2138 Woburn St
- 2316 Xenia St
- 2409 Xenia St
- 2325 Valencia St
- 950 Yew St
- 2330 Verona St
- 2602 Woburn St
- 2735 Michigan St
- 1735 Sunup Loop
- 1737 Sunup Loop
- 1733 Sunup Loop
- 2312 Orleans St
- 2209 W Birch St
- 2104 Birch Cir Unit 5C
- 1712 Sunup Loop
- 1714 Sunup Loop
- 1716 Sunup Loop
- 2612 Birch St
- 3700 Alabama St Unit 316
- 0 US Highway 27 Hwy N Unit MFRP4936152
- 2210 Xenia St Unit B
- 2210 Xenia St Unit A
- 2216 Xenia St
- 2218 Xenia St
- 2208 Xenia St Unit 2206
- 2206 Xenia St Unit 2206
- 2222 Xenia St
- 2211 Yew St
- 2207 Yew St
- 2245 Xenia St
- 2204 Xenia St
- 2205 Yew St
- 2217 Yew St
- 2202 Xenia St
- 2221 Xenia Ln
- 2228 Xenia St
- 2215 Xenia Ln
- 2227 Xenia Ln
- 2221 W Xenia Ln
- 2145 Yew St