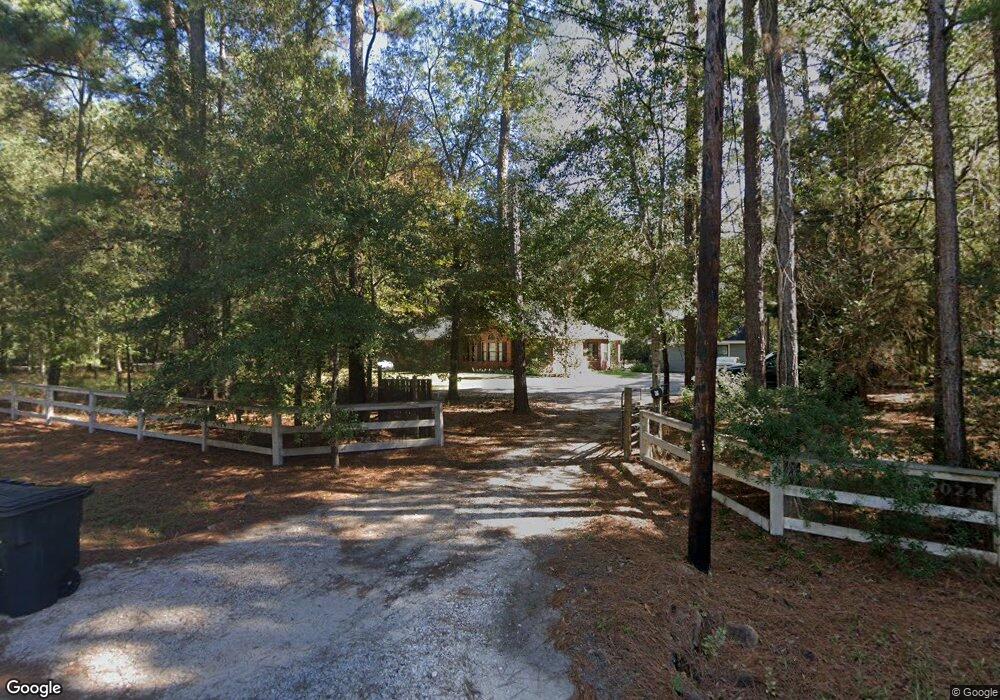
22120 Glenmont Estates Blvd Magnolia, TX 77355
Estimated Value: $697,000 - $774,987
4
Beds
3
Baths
2,749
Sq Ft
$270/Sq Ft
Est. Value
About This Home
This home is located at 22120 Glenmont Estates Blvd, Magnolia, TX 77355 and is currently estimated at $742,329, approximately $270 per square foot. 22120 Glenmont Estates Blvd is a home located in Montgomery County with nearby schools including J.L. Lyon Elementary School, Magnolia Sixth Grade Campus, and Magnolia Junior High School.
Ownership History
Date
Name
Owned For
Owner Type
Purchase Details
Closed on
Mar 10, 2017
Sold by
Swadley Michael
Bought by
Dolen Stephen Troy and Dolen Stephanie Tylynn
Current Estimated Value
Home Financials for this Owner
Home Financials are based on the most recent Mortgage that was taken out on this home.
Original Mortgage
$336,996
Outstanding Balance
$281,223
Interest Rate
4.4%
Mortgage Type
FHA
Estimated Equity
$461,106
Purchase Details
Closed on
Jun 15, 2011
Sold by
Juhasz Diane and Juhasz Diane Carol
Bought by
Swadley Michael and Swadley Charlsie
Home Financials for this Owner
Home Financials are based on the most recent Mortgage that was taken out on this home.
Original Mortgage
$199,800
Interest Rate
4.66%
Mortgage Type
New Conventional
Purchase Details
Closed on
Feb 1, 1984
Sold by
Juhasz Diane
Bought by
Dolen Stephen T and Dolen Stephanie T
Create a Home Valuation Report for This Property
The Home Valuation Report is an in-depth analysis detailing your home's value as well as a comparison with similar homes in the area
Home Values in the Area
Average Home Value in this Area
Purchase History
| Date | Buyer | Sale Price | Title Company |
|---|---|---|---|
| Dolen Stephen Troy | -- | Stewart Title Of Montgomery | |
| Swadley Michael | -- | None Available | |
| Dolen Stephen T | -- | -- | |
| Dolen Stephen T | -- | -- |
Source: Public Records
Mortgage History
| Date | Status | Borrower | Loan Amount |
|---|---|---|---|
| Open | Dolen Stephen Troy | $336,996 | |
| Previous Owner | Dolen Stephen T | $199,800 |
Source: Public Records
Tax History Compared to Growth
Tax History
| Year | Tax Paid | Tax Assessment Tax Assessment Total Assessment is a certain percentage of the fair market value that is determined by local assessors to be the total taxable value of land and additions on the property. | Land | Improvement |
|---|---|---|---|---|
| 2025 | $6,943 | $583,476 | $180,600 | $402,876 |
| 2024 | $6,208 | $530,783 | -- | -- |
| 2023 | $6,208 | $482,530 | $180,600 | $449,250 |
| 2022 | $7,741 | $438,660 | $180,600 | $346,470 |
| 2021 | $7,412 | $398,780 | $105,000 | $293,780 |
| 2020 | $7,892 | $390,000 | $105,000 | $285,000 |
| 2019 | $7,512 | $373,000 | $105,000 | $268,000 |
| 2018 | $7,997 | $415,590 | $0 | $0 |
| 2017 | $6,850 | $323,040 | $0 | $0 |
| 2016 | $6,227 | $293,670 | $0 | $0 |
| 2015 | $4,992 | $266,970 | $0 | $0 |
| 2014 | $4,992 | $242,700 | $17,600 | $225,100 |
Source: Public Records
Map
Nearby Homes
- 21802 Lindheimer Rd
- 000 Bergman Dr
- 21701 Glenmont Blvd
- 25340 Brushby Creek Dr
- 24519 Panther Branch Rd
- 25514 W Blackwater Creek Trail
- 25518 W Blackwater Creek Trail
- 0 Prop Id 101208 Unit 35069205
- 25522 W Blackwater Creek Trail
- 24515 Panther Branch Rd
- 24520 Panther Branch Rd
- 25308 Brushby Creek Dr
- 24516 Panther Branch Rd
- 25327 Brushby Creek Dr
- 24507 Panther Branch Rd
- 25304 Brushby Creek Dr
- 24512 Panther Branch Rd
- Glimmer Plan at Spring Creek Trails
- Falcon Plan at Spring Creek Trails
- Radiance Plan at Spring Creek Trails
- 21701 Dan Dr
- 5 acres Rose Cir
- 3 acres Rose Cir
- TBD Dan Cir
- 0000 Rose Cir
- 22123 Glenmont Estates Blvd
- 21702 Dan Cir
- 21711 Dan Dr
- Lot 32C and 33A Rose Cir
- 00 Rose Cir
- Lot 34B Rose Cir
- 000 Dan Dr
- 21806 Rose Cir
- 22202 Glenmont Blvd
- 21815 Rose Cir
- 22210 Glenmont Estates Blvd
- 22303 Glenmont Estates Blvd
- TBD2 Dan Cir
- 0 NW Glenmont Estates Blvd
- 21819 Rose Cir