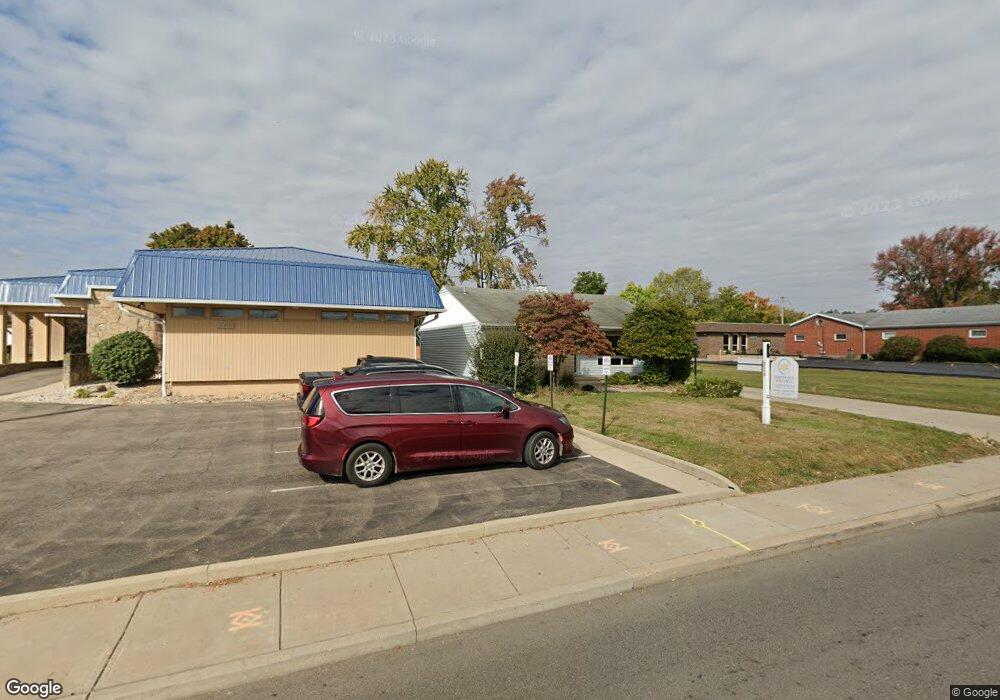
2213 N Limestone St Springfield, OH 45503
Estimated Value: $197,356
6
Beds
1
Bath
1,072
Sq Ft
$184/Sq Ft
Est. Value
About This Home
This home is located at 2213 N Limestone St, Springfield, OH 45503 and is currently estimated at $197,356, approximately $184 per square foot. 2213 N Limestone St is a home located in Clark County with nearby schools including Snowhill Elementary School, Roosevelt Middle School, and Springfield High School.
Ownership History
Date
Name
Owned For
Owner Type
Purchase Details
Closed on
Oct 28, 2019
Sold by
Bullis Howard A and Stewart Bonnie H
Bought by
Huma A Bashir Llc
Current Estimated Value
Home Financials for this Owner
Home Financials are based on the most recent Mortgage that was taken out on this home.
Original Mortgage
$120,000
Outstanding Balance
$105,325
Interest Rate
3.7%
Mortgage Type
Future Advance Clause Open End Mortgage
Estimated Equity
$92,031
Purchase Details
Closed on
Aug 26, 2006
Sold by
Green Sherry M
Bought by
Bullis Howard A and Stewart Bonnie H
Home Financials for this Owner
Home Financials are based on the most recent Mortgage that was taken out on this home.
Original Mortgage
$68,000
Interest Rate
6.78%
Mortgage Type
Commercial
Purchase Details
Closed on
Jul 6, 1993
Sold by
Bowen Dorothy
Bought by
Stewart Bonnie H and Green Sherry M
Purchase Details
Closed on
Nov 24, 1992
Create a Home Valuation Report for This Property
The Home Valuation Report is an in-depth analysis detailing your home's value as well as a comparison with similar homes in the area
Home Values in the Area
Average Home Value in this Area
Purchase History
We collect this data history from publicly available records. To have your information removed, we recommend requesting removal directly through your county’s website.
| Date | Buyer | Sale Price | Title Company |
|---|---|---|---|
| Huma A Bashir Llc | $120,000 | None Available | |
| Bullis Howard A | $40,000 | None Available | |
| Stewart Bonnie H | $80,000 | -- | |
| -- | -- | -- |
Source: Public Records
Mortgage History
We collect this data history from publicly available records. To have your information removed, we recommend requesting removal directly through your county’s website.
| Date | Status | Borrower | Loan Amount |
|---|---|---|---|
| Open | Huma A Bashir Llc | $120,000 | |
| Previous Owner | Bullis Howard A | $68,000 |
Source: Public Records
Tax History
| Year | Tax Paid | Tax Assessment Tax Assessment Total Assessment is a certain percentage of the fair market value that is determined by local assessors to be the total taxable value of land and additions on the property. | Land | Improvement |
|---|---|---|---|---|
| 2025 | $1,795 | $45,400 | $11,460 | $33,940 |
| 2024 | $1,764 | $24,310 | $8,180 | $16,130 |
| 2023 | $1,764 | $24,310 | $8,180 | $16,130 |
| 2022 | $1,663 | $24,310 | $8,180 | $16,130 |
| 2021 | $1,776 | $24,310 | $8,180 | $16,130 |
| 2020 | $2,199 | $24,310 | $8,180 | $16,130 |
| 2019 | $2,204 | $24,310 | $8,180 | $16,130 |
| 2018 | $2,093 | $22,750 | $8,180 | $14,570 |
| 2017 | $2,104 | $22,750 | $8,183 | $14,567 |
| 2016 | $2,096 | $22,750 | $8,183 | $14,567 |
| 2015 | $1,692 | $22,750 | $8,183 | $14,567 |
| 2014 | $1,673 | $22,750 | $8,183 | $14,567 |
| 2013 | $1,636 | $22,750 | $8,183 | $14,567 |
Source: Public Records
Map
Nearby Homes
- 146 N Kensington Place
- 150 S Kensington Place
- 0 E Home Rd
- 1810 N Limestone St
- 118 Hampton Place
- 2438 Signal Hill Rd
- 2516 Rebecca Dr
- 1774 Northpoint Rd
- 1767 Northpoint Rd
- 1766 Northpoint Rd
- 1758 Northpoint Rd
- 366 Northfield Blvd Unit 1C
- 1663-1665 Brentwood Dr
- 327 Ardmore Rd
- 124 Hawthorne Rd
- 1507 N Limestone St
- 310 E 3rd St
- 2685 Kilkenny Ct
- 2416 Northmoor Dr
- 308 Ridge Rd
- 137 Trenton Place
- 120 Trenton Place
- 123 Trenton Place
- 110 Trenton Place
- 2222 Shawnee Blvd
- 117 Trenton Place
- 2131 N Limestone St
- 2131 N Limestone St Unit 1
- 2226 Shawnee Blvd
- 104 Trenton Place
- 111 Trenton Place
- 2230 Shawnee Blvd
- 2245 N Limestone St
- 129 E Home Rd
- 121 E Home Rd
- 105 Trenton Place
- 150 N Kensington Place
- 142 N Kensington Place
- 2250 N Limestone St
- 2126 N Limestone St
Your Personal Tour Guide
Ask me questions while you tour the home.