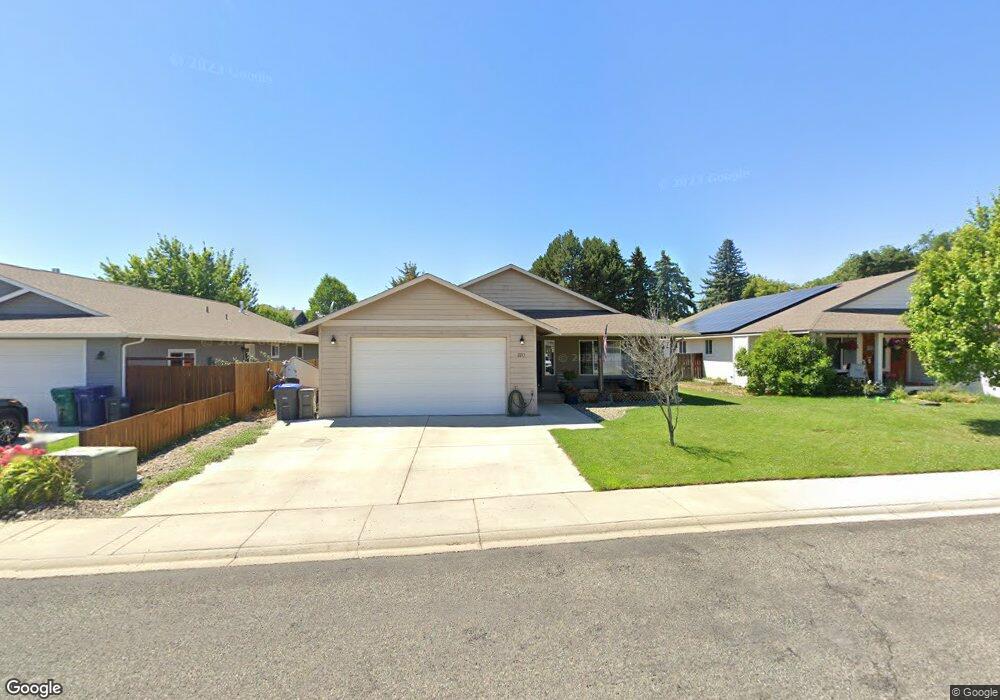
2213 N Spar Ln Ellensburg, WA 98926
Estimated Value: $382,000 - $502,000
3
Beds
2
Baths
1,631
Sq Ft
$276/Sq Ft
Est. Value
About This Home
This home is located at 2213 N Spar Ln, Ellensburg, WA 98926 and is currently estimated at $449,427, approximately $275 per square foot. 2213 N Spar Ln is a home located in Kittitas County with nearby schools including Creative Kids Learning Center and Ellensburg Christian School.
Ownership History
Date
Name
Owned For
Owner Type
Purchase Details
Closed on
Oct 18, 2024
Sold by
Arnold Andy D and Arnold Magdelina
Bought by
Chittenden Karlee Jo and Chittenden Coy A
Current Estimated Value
Home Financials for this Owner
Home Financials are based on the most recent Mortgage that was taken out on this home.
Original Mortgage
$14,630
Outstanding Balance
$9,526
Interest Rate
6.2%
Mortgage Type
New Conventional
Estimated Equity
$439,901
Purchase Details
Closed on
May 12, 2010
Sold by
Sparling Michael and Sparling Jean
Bought by
Sparling Plat Homeowners Assn
Purchase Details
Closed on
Mar 20, 2007
Sold by
Hoskin Paul W and Hoskin Mandy
Bought by
Arnold Andy D
Home Financials for this Owner
Home Financials are based on the most recent Mortgage that was taken out on this home.
Original Mortgage
$168,000
Interest Rate
6.31%
Mortgage Type
New Conventional
Create a Home Valuation Report for This Property
The Home Valuation Report is an in-depth analysis detailing your home's value as well as a comparison with similar homes in the area
Home Values in the Area
Average Home Value in this Area
Purchase History
| Date | Buyer | Sale Price | Title Company |
|---|---|---|---|
| Chittenden Karlee Jo | $385,000 | None Listed On Document | |
| Chittenden Karlee Jo | $385,000 | None Listed On Document | |
| Sparling Plat Homeowners Assn | -- | None Available | |
| Arnold Andy D | $210,000 | Amerititle |
Source: Public Records
Mortgage History
| Date | Status | Borrower | Loan Amount |
|---|---|---|---|
| Open | Chittenden Karlee Jo | $14,630 | |
| Closed | Chittenden Karlee Jo | $14,630 | |
| Open | Chittenden Karlee Jo | $365,750 | |
| Closed | Chittenden Karlee Jo | $365,750 | |
| Previous Owner | Arnold Andy D | $168,000 |
Source: Public Records
Tax History Compared to Growth
Tax History
| Year | Tax Paid | Tax Assessment Tax Assessment Total Assessment is a certain percentage of the fair market value that is determined by local assessors to be the total taxable value of land and additions on the property. | Land | Improvement |
|---|---|---|---|---|
| 2025 | $160 | $369,450 | $121,960 | $247,490 |
| 2023 | $3,475 | $359,430 | $91,990 | $267,440 |
| 2022 | $3,350 | $298,660 | $71,540 | $227,120 |
| 2021 | $3,285 | $276,930 | $61,120 | $215,810 |
| 2019 | $2,794 | $227,880 | $45,840 | $182,040 |
| 2018 | $2,436 | $212,450 | $45,840 | $166,610 |
| 2017 | $2,381 | $171,050 | $35,000 | $136,050 |
| 2016 | $2,302 | $171,050 | $35,000 | $136,050 |
| 2015 | $2,189 | $171,050 | $35,000 | $136,050 |
| 2013 | -- | $171,050 | $35,000 | $136,050 |
Source: Public Records
Map
Nearby Homes
- 2209 N Spar Ln
- 244 N Abbey Glen Ct
- 2304 N Ellington St
- 400 E 24th Ave
- 2109 N Parklane Ave
- 2510 N Spar Ln
- 1904 N Parklane Ave
- 1811 Regal St
- 2514 N Benjamin Ln
- 101 W Courtney Ct
- 209 E 18th Ave Unit D17
- 402 W Helena Ave
- 101 E Kristen Ave
- 809 E White Birch Ave
- 508 W Bender Rd
- 810 E White Birch Ave
- 300 E Country Side Ave
- 2515 N Snowdrop St
- 203 E Chason Ave
- 515 W Bridgewood Ln
- 2211 N Spar Ln
- 2215 N Spar Ln
- 206 E Idaho Ave
- 208 E Idaho Ave
- 2212 N Spar Ln
- 2214 N Spar Ln
- 2219 N Spar Ln
- 204 E Idaho Ave
- 2210 N Spar Ln
- 300 E Idaho Ave
- 2216 N Spar Ln
- 2208 N Abbey Glen Ct
- 2206 N Spar Ln
- 108 E Idaho Ave
- 109 E Helena Ave
- 2208 N Spar Ln
- 302 E Idaho Ave
- 2211 N Cobblefield St
- 2209 N Cobblefield St Unit Lot 4
- 2209 N Cobblefield St