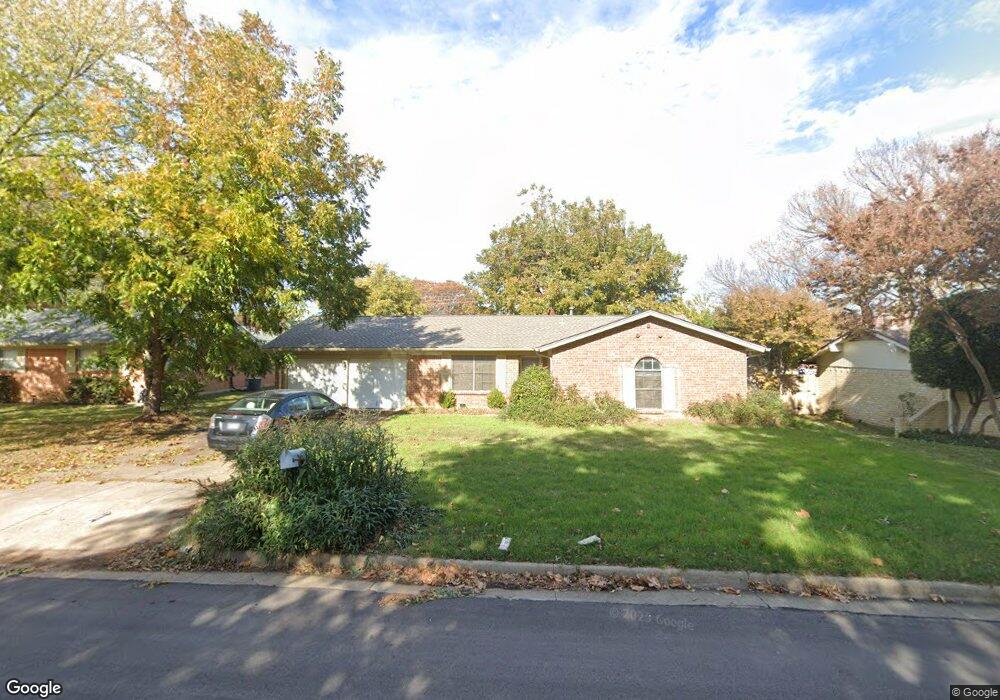
2213 Nottingham Dr Bedford, TX 76022
Estimated Value: $327,563 - $343,000
3
Beds
2
Baths
1,524
Sq Ft
$219/Sq Ft
Est. Value
About This Home
This home is located at 2213 Nottingham Dr, Bedford, TX 76022 and is currently estimated at $334,141, approximately $219 per square foot. 2213 Nottingham Dr is a home located in Tarrant County with nearby schools including Bell Manor Elementary School, Central J High School, and Trinity High School.
Ownership History
Date
Name
Owned For
Owner Type
Purchase Details
Closed on
Jul 14, 2005
Sold by
Domingues Silvio and Domingues Callie
Bought by
Olms Dina A
Current Estimated Value
Home Financials for this Owner
Home Financials are based on the most recent Mortgage that was taken out on this home.
Original Mortgage
$102,000
Outstanding Balance
$59,243
Interest Rate
7.45%
Mortgage Type
Fannie Mae Freddie Mac
Estimated Equity
$274,898
Purchase Details
Closed on
Mar 1, 2000
Sold by
Blackburn Ronald Clifton
Bought by
Engle William Thomas
Home Financials for this Owner
Home Financials are based on the most recent Mortgage that was taken out on this home.
Original Mortgage
$80,000
Interest Rate
8.23%
Mortgage Type
Seller Take Back
Purchase Details
Closed on
Aug 31, 1997
Sold by
Engle William T and Engle William T
Bought by
Blackburn Ronald and Blackburn Patricia
Home Financials for this Owner
Home Financials are based on the most recent Mortgage that was taken out on this home.
Original Mortgage
$80,000
Interest Rate
7.28%
Mortgage Type
Seller Take Back
Create a Home Valuation Report for This Property
The Home Valuation Report is an in-depth analysis detailing your home's value as well as a comparison with similar homes in the area
Home Values in the Area
Average Home Value in this Area
Purchase History
| Date | Buyer | Sale Price | Title Company |
|---|---|---|---|
| Olms Dina A | -- | -- | |
| Engle William Thomas | -- | -- | |
| Blackburn Ronald | -- | -- |
Source: Public Records
Mortgage History
| Date | Status | Borrower | Loan Amount |
|---|---|---|---|
| Open | Olms Dina A | $102,000 | |
| Previous Owner | Engle William Thomas | $80,000 | |
| Previous Owner | Blackburn Ronald | $80,000 |
Source: Public Records
Tax History Compared to Growth
Tax History
| Year | Tax Paid | Tax Assessment Tax Assessment Total Assessment is a certain percentage of the fair market value that is determined by local assessors to be the total taxable value of land and additions on the property. | Land | Improvement |
|---|---|---|---|---|
| 2025 | $2,989 | $241,056 | $65,000 | $176,056 |
| 2024 | $2,989 | $241,056 | $65,000 | $176,056 |
| 2023 | $3,735 | $224,398 | $45,000 | $179,398 |
| 2022 | $3,867 | $190,852 | $45,000 | $145,852 |
| 2021 | $3,791 | $160,936 | $45,000 | $115,936 |
| 2020 | $4,049 | $170,304 | $45,000 | $125,304 |
| 2019 | $4,086 | $172,656 | $45,000 | $127,656 |
| 2018 | $3,333 | $152,897 | $18,000 | $134,897 |
| 2017 | $3,434 | $157,777 | $18,000 | $139,777 |
| 2016 | $3,121 | $139,451 | $18,000 | $121,451 |
| 2015 | $2,671 | $117,300 | $18,000 | $99,300 |
| 2014 | $2,671 | $117,300 | $18,000 | $99,300 |
Source: Public Records
Map
Nearby Homes
- 2024 Charleston Dr
- 1049 Stableway Ln
- 2101 Gettysburg Place
- 1213 Greendale Dr
- 2201 Greendale Ct
- 1116 Highpoint Rd
- 2025 Schumac Ln
- 828 Gregory Ave
- 2421 Creek Villas Dr
- 2428 Chestnut Way
- 2420 Dalewood Ln
- 952 Charleston Dr
- 808 Gregory Ave
- 933 Charleston Ct
- 800 Prestwick St
- 804 Natchez Ave
- 1613 Trinity Ct
- 1701 Winchester Way
- 2620 Britany Cir
- 2504 Westpark Way Cir
- 2217 Nottingham Dr
- 2209 Nottingham Dr
- 2212 Highcrest Dr
- 2216 Highcrest Dr
- 2208 Highcrest Dr
- 2205 Nottingham Dr
- 1101 Sherwood Dr
- 1105 Sherwood Dr
- 2212 Nottingham Dr
- 2216 Nottingham Dr
- 2208 Nottingham Dr
- 2204 Highcrest Dr
- 1017 Sherwood Dr
- 2201 Nottingham Dr
- 2204 Nottingham Dr
- 2200 Highcrest Dr
- 1013 Sherwood Dr
- 2200 Nottingham Dr
- 2213 Highcrest Dr
- 2209 Highcrest Dr