Estimated Value: $531,289 - $552,000
4
Beds
3
Baths
2,075
Sq Ft
$260/Sq Ft
Est. Value
About This Home
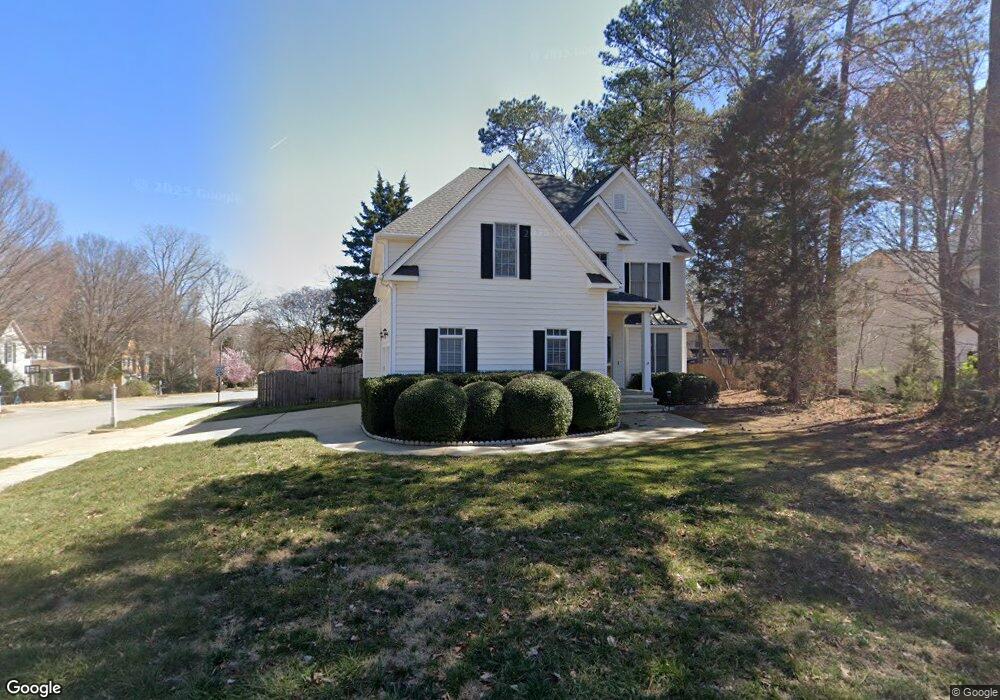
This home is located at 2213 Spring Fern Ct, Apex, NC 27502 and is currently estimated at $540,322, approximately $260 per square foot. 2213 Spring Fern Ct is a home located in Wake County with nearby schools including Penny Road Elementary School, Apex Middle, and Apex High School.
Ownership History
Date
Name
Owned For
Owner Type
Purchase Details
Closed on
Aug 29, 2003
Sold by
Edwards Chereise T and Edwards John W
Bought by
Curia Daniel M and Curia Lorrane D
Current Estimated Value
Home Financials for this Owner
Home Financials are based on the most recent Mortgage that was taken out on this home.
Original Mortgage
$149,600
Outstanding Balance
$66,908
Interest Rate
5.72%
Mortgage Type
Purchase Money Mortgage
Estimated Equity
$473,414
Purchase Details
Closed on
Oct 1, 1997
Sold by
Covenant Construction Inc
Bought by
Edwards John W and Edwards Chereise T
Home Financials for this Owner
Home Financials are based on the most recent Mortgage that was taken out on this home.
Original Mortgage
$174,420
Interest Rate
7.46%
Mortgage Type
VA
Create a Home Valuation Report for This Property
The Home Valuation Report is an in-depth analysis detailing your home's value as well as a comparison with similar homes in the area
Home Values in the Area
Average Home Value in this Area
Purchase History
| Date | Buyer | Sale Price | Title Company |
|---|---|---|---|
| Curia Daniel M | $187,000 | -- | |
| Edwards John W | $171,000 | -- |
Source: Public Records
Mortgage History
| Date | Status | Borrower | Loan Amount |
|---|---|---|---|
| Open | Curia Daniel M | $149,600 | |
| Previous Owner | Edwards John W | $174,420 |
Source: Public Records
Tax History Compared to Growth
Tax History
| Year | Tax Paid | Tax Assessment Tax Assessment Total Assessment is a certain percentage of the fair market value that is determined by local assessors to be the total taxable value of land and additions on the property. | Land | Improvement |
|---|---|---|---|---|
| 2025 | $4,435 | $505,724 | $180,000 | $325,724 |
| 2024 | $4,336 | $505,724 | $180,000 | $325,724 |
| 2023 | $3,630 | $329,118 | $90,000 | $239,118 |
| 2022 | $3,408 | $329,118 | $90,000 | $239,118 |
| 2021 | $3,278 | $329,118 | $90,000 | $239,118 |
| 2020 | $3,245 | $329,118 | $90,000 | $239,118 |
| 2019 | $3,113 | $272,343 | $90,000 | $182,343 |
| 2018 | $2,932 | $272,343 | $90,000 | $182,343 |
| 2017 | $2,730 | $272,343 | $90,000 | $182,343 |
| 2016 | $2,690 | $272,343 | $90,000 | $182,343 |
| 2015 | $2,474 | $244,314 | $60,000 | $184,314 |
| 2014 | -- | $244,314 | $60,000 | $184,314 |
Source: Public Records
Map
Nearby Homes
- 1209 Waterford Green Dr
- 2003 Chedington Dr
- 809 Green Passage Ln
- 644 Angelica Cir
- 938 Regency Cottage Place
- 1511 Waterland Dr
- 1003 Sunny Brae Ct
- 1106 Wellstone Cir
- 3015 Old Raleigh Rd
- 3007 Old Raleigh Rd
- 214 Williams Grove Ln Unit Lot 4
- 218 Williams Grove Ln
- 226 Williams Grove Ln
- 262 Williams Grove Ln Unit Lot 76
- 278 Williams Grove Ln Unit Lot 73
- 286 Williams Grove Ln Unit Lot 71
- 294 Williams Grove Ln Unit 69
- 294 Williams Grove Ln
- 298 Williams Grove Ln N Unit 68
- 265 Williams Grove Ln
- 2211 Spring Fern Ct
- 2412 Fordcrest Dr
- 2410 Fordcrest Dr
- 2308 Watersglen Dr
- 2212 Spring Fern Ct
- 2209 Spring Fern Ct
- 2310 Watersglen Dr
- 2306 Watersglen Dr
- 2210 Spring Fern Ct
- 2312 Watersglen Dr
- 2304 Watersglen Dr
- 2207 Spring Fern Ct
- 2411 Fordcrest Dr
- 2301 Watersglen Dr
- 2208 Spring Fern Ct
- 2400 Watersglen Dr
- 2409 Fordcrest Dr
- 2302 Watersglen Dr
- 2406 Fordcrest Dr
- 2407 Fordcrest Dr