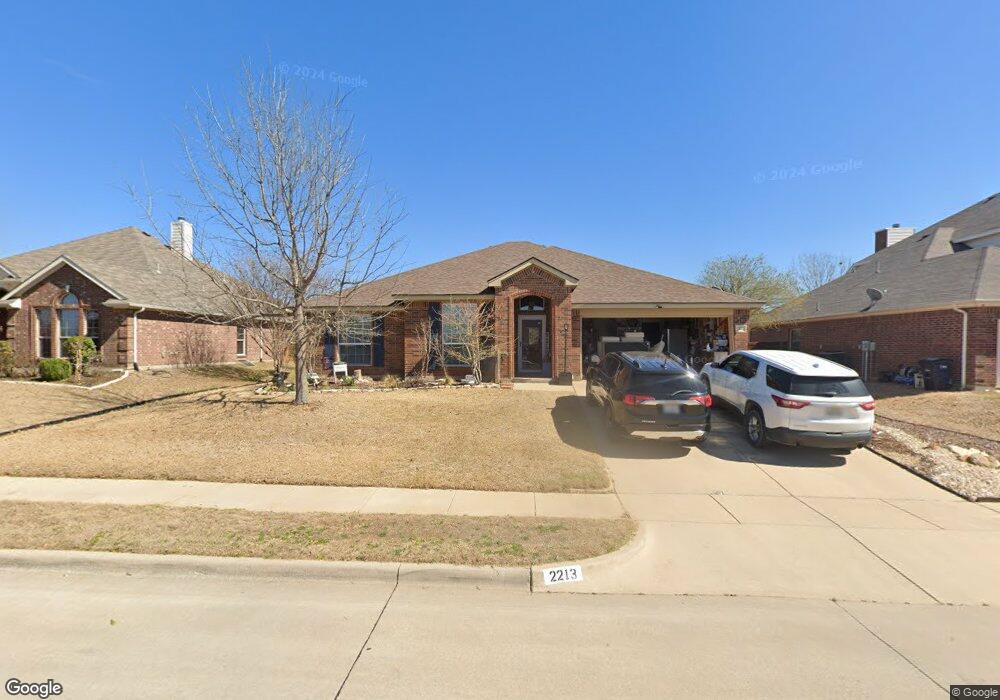
2213 Taylor Dr Weatherford, TX 76087
Estimated Value: $310,134 - $349,000
--
Bed
--
Bath
2,010
Sq Ft
$167/Sq Ft
Est. Value
About This Home
This home is located at 2213 Taylor Dr, Weatherford, TX 76087 and is currently estimated at $336,284, approximately $167 per square foot. 2213 Taylor Dr is a home located in Parker County with nearby schools including Curtis Elementary School, Hall Middle School, and Weatherford High School.
Ownership History
Date
Name
Owned For
Owner Type
Purchase Details
Closed on
Dec 14, 2017
Sold by
Wolf David Allen and Wolf Spencer Grey
Bought by
Wolf Lynnette
Current Estimated Value
Home Financials for this Owner
Home Financials are based on the most recent Mortgage that was taken out on this home.
Original Mortgage
$148,006
Outstanding Balance
$124,479
Interest Rate
3.9%
Mortgage Type
New Conventional
Estimated Equity
$211,805
Purchase Details
Closed on
Aug 25, 2009
Sold by
Cheldan Homes Lp
Bought by
Wolf David A and Wolf Lynnette
Home Financials for this Owner
Home Financials are based on the most recent Mortgage that was taken out on this home.
Original Mortgage
$160,101
Interest Rate
5.16%
Mortgage Type
FHA
Purchase Details
Closed on
Mar 26, 2009
Sold by
Smrp Ltd
Bought by
Wolf David A and Wolf Lynnette
Create a Home Valuation Report for This Property
The Home Valuation Report is an in-depth analysis detailing your home's value as well as a comparison with similar homes in the area
Home Values in the Area
Average Home Value in this Area
Purchase History
| Date | Buyer | Sale Price | Title Company |
|---|---|---|---|
| Wolf Lynnette | -- | None Available | |
| Wolf David A | -- | Stnt | |
| Wolf David A | -- | -- | |
| Cheldan Homes Lp | -- | Stnt |
Source: Public Records
Mortgage History
| Date | Status | Borrower | Loan Amount |
|---|---|---|---|
| Open | Wolf Lynnette | $148,006 | |
| Closed | Wolf David A | $160,101 |
Source: Public Records
Tax History Compared to Growth
Tax History
| Year | Tax Paid | Tax Assessment Tax Assessment Total Assessment is a certain percentage of the fair market value that is determined by local assessors to be the total taxable value of land and additions on the property. | Land | Improvement |
|---|---|---|---|---|
| 2025 | $3,692 | $312,228 | -- | -- |
| 2024 | $3,692 | $283,844 | -- | -- |
| 2023 | $3,692 | $258,040 | $0 | $0 |
| 2022 | $5,204 | $234,590 | $25,000 | $209,590 |
| 2021 | $5,634 | $234,590 | $25,000 | $209,590 |
| 2020 | $5,265 | $217,890 | $25,000 | $192,890 |
| 2019 | $5,564 | $217,890 | $25,000 | $192,890 |
| 2018 | $4,873 | $189,960 | $25,000 | $164,960 |
| 2017 | $4,998 | $189,960 | $25,000 | $164,960 |
| 2016 | $4,329 | $164,540 | $25,000 | $139,540 |
| 2015 | $4,240 | $164,540 | $25,000 | $139,540 |
| 2014 | $3,780 | $150,520 | $25,000 | $125,520 |
Source: Public Records
Map
Nearby Homes
- 2209 Caroline Dr
- 914 Randall Rd
- 909 Jodie Dr
- 842 Randall Rd
- 825 Jodie Dr
- 1220 Scott Dr
- 1036 Deer Valley Dr
- 2533 Hadley St
- 2532 Hadley St
- 2361 Waggoner Ranch Dr
- 2381 Waggoner Ranch Dr
- 2416 Waggoner Ranch Dr
- 2344 Briscoe Ranch Dr
- 1015 W Park Ave Unit D
- 1015 W Park Ave Unit LOT A
- 1015 W Park Ave Unit LOT B
- 1921 Bay Laurel Dr
- 1252 Kerrville Ln
- 3770 Bethel Rd
- 741 Nandina Rd