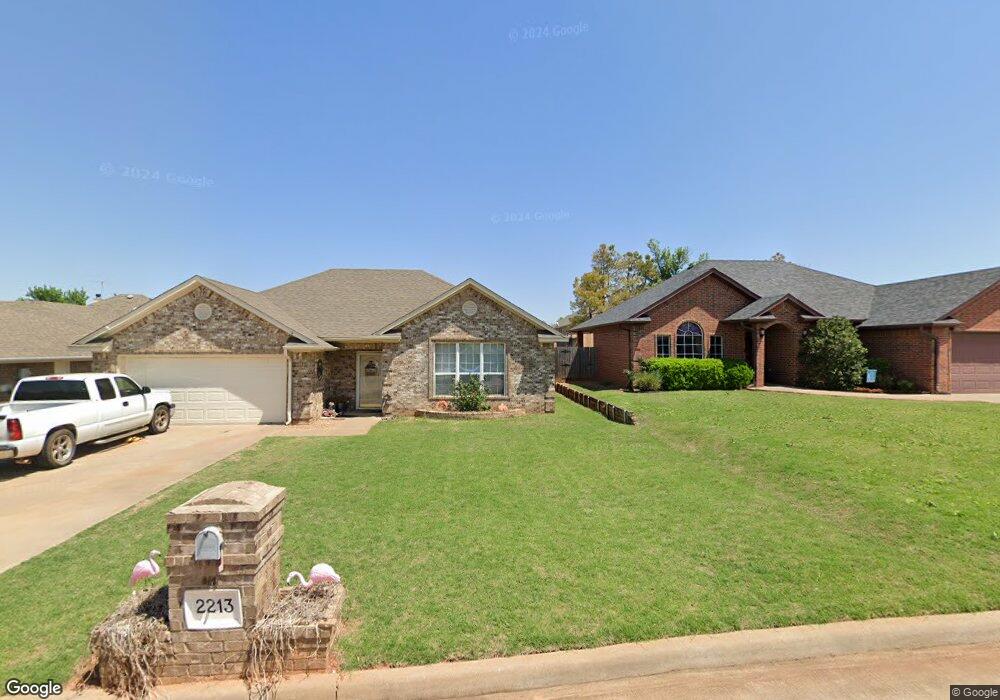
2213 University Blvd Chickasha, OK 73018
Estimated Value: $151,000 - $253,000
3
Beds
2
Baths
1,372
Sq Ft
$146/Sq Ft
Est. Value
About This Home
This home is located at 2213 University Blvd, Chickasha, OK 73018 and is currently estimated at $199,757, approximately $145 per square foot. 2213 University Blvd is a home located in Grady County with nearby schools including Grand Avenue Elementary School, Chickasha Middle School, and Lincoln Elementary School.
Ownership History
Date
Name
Owned For
Owner Type
Purchase Details
Closed on
Sep 13, 2018
Sold by
Holt John and Holt Lorie
Bought by
Schmidt Kolby and Schmiddt Emily
Current Estimated Value
Home Financials for this Owner
Home Financials are based on the most recent Mortgage that was taken out on this home.
Original Mortgage
$127,645
Outstanding Balance
$111,097
Interest Rate
4.6%
Mortgage Type
FHA
Estimated Equity
$88,660
Purchase Details
Closed on
Aug 25, 2014
Sold by
Bates Kristi
Bought by
Holt John and Holt Lorie
Purchase Details
Closed on
Jul 31, 2006
Sold by
Mulvaney Christopher J and Mulvaney Felicia G
Bought by
Bates Kristi
Home Financials for this Owner
Home Financials are based on the most recent Mortgage that was taken out on this home.
Original Mortgage
$26,000
Interest Rate
6.66%
Mortgage Type
Stand Alone Second
Purchase Details
Closed on
Dec 5, 2003
Sold by
Willmon Stephen B
Bought by
Mulvaney Christopher
Create a Home Valuation Report for This Property
The Home Valuation Report is an in-depth analysis detailing your home's value as well as a comparison with similar homes in the area
Home Values in the Area
Average Home Value in this Area
Purchase History
| Date | Buyer | Sale Price | Title Company |
|---|---|---|---|
| Schmidt Kolby | $130,000 | None Available | |
| Holt John | $131,000 | -- | |
| Bates Kristi | $130,000 | None Available | |
| Mulvaney Christopher | $111,800 | -- |
Source: Public Records
Mortgage History
| Date | Status | Borrower | Loan Amount |
|---|---|---|---|
| Open | Schmidt Kolby | $127,645 | |
| Previous Owner | Bates Kristi | $26,000 |
Source: Public Records
Tax History Compared to Growth
Tax History
| Year | Tax Paid | Tax Assessment Tax Assessment Total Assessment is a certain percentage of the fair market value that is determined by local assessors to be the total taxable value of land and additions on the property. | Land | Improvement |
|---|---|---|---|---|
| 2025 | $1,405 | $15,300 | $1,224 | $14,076 |
| 2024 | $1,405 | $14,854 | $1,188 | $13,666 |
| 2023 | $1,405 | $14,421 | $1,271 | $13,150 |
| 2022 | $1,362 | $14,095 | $1,271 | $12,824 |
| 2021 | $1,312 | $14,053 | $1,271 | $12,782 |
| 2020 | $1,386 | $14,464 | $1,271 | $13,193 |
| 2019 | $1,344 | $14,300 | $1,271 | $13,029 |
| 2018 | $1,501 | $14,578 | $1,271 | $13,307 |
| 2017 | $1,530 | $14,780 | $1,271 | $13,509 |
| 2016 | $1,559 | $14,936 | $1,271 | $13,665 |
| 2015 | $1,438 | $15,179 | $1,271 | $13,908 |
| 2014 | $1,438 | $14,729 | $1,211 | $13,518 |
Source: Public Records
Map
Nearby Homes
- 2210 Lakewood Dr
- 2305 Lakewood Dr
- 3400 W Mississippi Ave
- 3208 California Ave
- 2412 S 30th St
- 2812 Scissortail Dr
- 2821 S 27th Ct
- 2329 S 28th Terrace
- 2825 S 27th Ct
- 2801 S 27th Ct
- 2328 S 27th Ct
- 2817 S 27th Ct
- 2401 S 28th Terrace
- 2329 S 27th Ct
- 2805 S 27th Ct
- 2409 S 27th Ct
- 2325 S 28th Terrace
- 2400 S 27th Ct
- 2405 S 28th Terrace
- 2325 S 27th Ct
- 2211 University Blvd
- 2215 University Blvd
- 2209 University Blvd
- 2217 University Blvd
- 2605 Lakewood Dr
- 2603 Lakewood Dr
- 2607 Lakewood Dr
- 2212 University Blvd
- 2210 University Blvd
- 2214 University Blvd
- 2219 University Blvd
- 2207 University Blvd
- 2208 University Blvd
- 2216 University Blvd
- 2601 Lakewood Dr
- 2609 Lakewood Dr
- 2221 University Blvd
- 2206 University Blvd
- 2604 Lakewood Dr
- 2602 Lakewood Dr