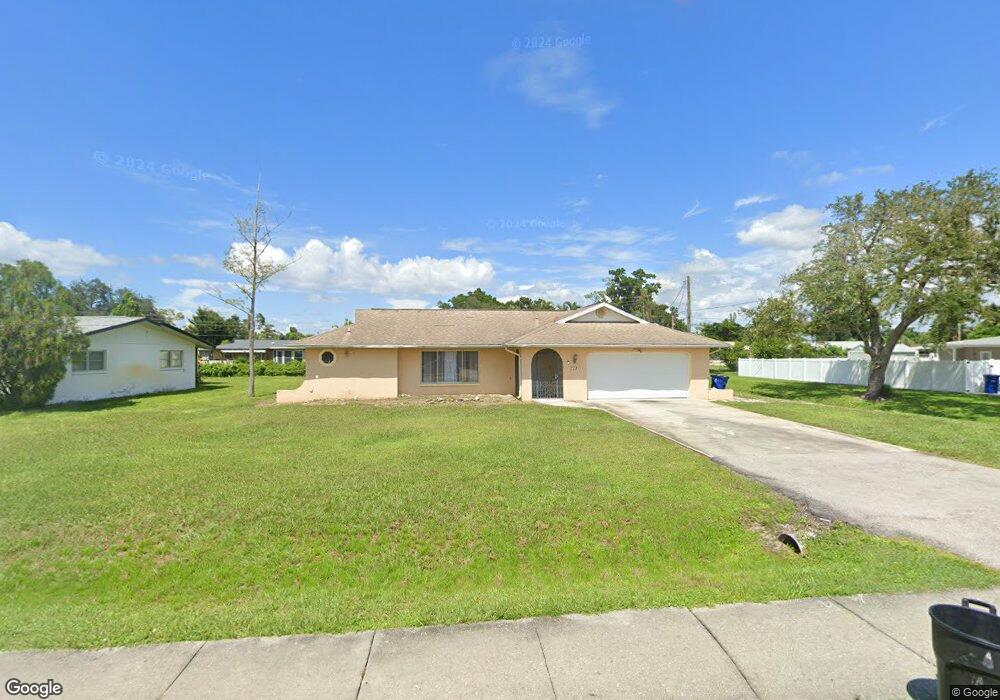
2213 Woodland Blvd Fort Myers, FL 33907
Estimated Value: $285,000 - $345,000
3
Beds
2
Baths
1,809
Sq Ft
$175/Sq Ft
Est. Value
About This Home
This home is located at 2213 Woodland Blvd, Fort Myers, FL 33907 and is currently estimated at $316,594, approximately $175 per square foot. 2213 Woodland Blvd is a home located in Lee County with nearby schools including Orangewood Elementary School, Allen Park Elementary School, and Edison Park Creative & Expressive Arts School.
Ownership History
Date
Name
Owned For
Owner Type
Purchase Details
Closed on
Feb 19, 2009
Sold by
Wells Fargo Bank Na
Bought by
Soares Lilian
Current Estimated Value
Purchase Details
Closed on
Jan 6, 2009
Sold by
Shelatz Richard and Shelatz Richard S
Bought by
Wells Fargo Bank Na
Purchase Details
Closed on
Oct 4, 2006
Sold by
Shelatz Richard S and Shelatz Martha A
Bought by
Shelatz Richard S
Purchase Details
Closed on
Jul 30, 1999
Sold by
Mccluskey Gary and Mccluskey Amy
Bought by
Shelatz Richard S and Shelatz Martha A
Home Financials for this Owner
Home Financials are based on the most recent Mortgage that was taken out on this home.
Original Mortgage
$95,950
Interest Rate
7.66%
Purchase Details
Closed on
Dec 6, 1995
Sold by
Mccluskey Gary and Mccluskey Amy
Bought by
Mccluskey Gary and Mccluskey Amy
Create a Home Valuation Report for This Property
The Home Valuation Report is an in-depth analysis detailing your home's value as well as a comparison with similar homes in the area
Home Values in the Area
Average Home Value in this Area
Purchase History
| Date | Buyer | Sale Price | Title Company |
|---|---|---|---|
| Soares Lilian | $78,000 | Watson Title Insurance Agenc | |
| Wells Fargo Bank Na | -- | None Available | |
| Shelatz Richard S | -- | Connection Title Llc | |
| Shelatz Richard S | $102,000 | -- | |
| Mccluskey Gary | -- | -- |
Source: Public Records
Mortgage History
| Date | Status | Borrower | Loan Amount |
|---|---|---|---|
| Previous Owner | Shelatz Richard S | $95,950 |
Source: Public Records
Tax History Compared to Growth
Tax History
| Year | Tax Paid | Tax Assessment Tax Assessment Total Assessment is a certain percentage of the fair market value that is determined by local assessors to be the total taxable value of land and additions on the property. | Land | Improvement |
|---|---|---|---|---|
| 2025 | $3,577 | $226,287 | -- | -- |
| 2024 | $3,277 | $205,715 | -- | -- |
| 2023 | $3,277 | $187,014 | $0 | $0 |
| 2022 | $2,960 | $170,013 | $0 | $0 |
| 2021 | $2,581 | $172,021 | $38,500 | $133,521 |
| 2020 | $2,325 | $140,506 | $38,500 | $102,006 |
| 2019 | $2,271 | $136,469 | $38,500 | $97,969 |
| 2018 | $2,341 | $138,084 | $38,500 | $99,584 |
| 2017 | $2,351 | $140,508 | $30,000 | $110,508 |
| 2016 | $2,227 | $130,699 | $30,000 | $100,699 |
| 2015 | $2,016 | $110,303 | $30,000 | $80,303 |
| 2014 | $1,878 | $106,196 | $18,000 | $88,196 |
| 2013 | -- | $119,296 | $10,000 | $109,296 |
Source: Public Records
Map
Nearby Homes
- 2207 Woodland Blvd
- 8925 Dorchester St
- 124 Pinebrook Dr Unit 124
- 116 Pinebrook Dr
- 104 Pinebrook Dr
- 13208 Tall Pine Cir
- 907 Big Pine Way
- 2248 Ephraim Ave
- 13108 Tall Pine Cir
- 13044 Tall Pine Cir
- 2355 Ivy Ave
- 2362 Harvard Ave
- 12571 Equestrian Cir Unit 902
- 12581 Equestrian Cir Unit 1016
- 12591 Equestrian Cir Unit 1207
- 12591 Equestrian Cir Unit 1214
- 12551 Equestrian Cir Unit 706
- 5404 Ashton Cir
- 2137 Sunrise Blvd
- 2118 Aldridge Ave
- 2219 Woodland Blvd
- 2212 Ivy Ave
- 8812 Chatham St
- 2214 Woodland Blvd
- 2218 Ivy Ave
- 2201 Woodland Blvd
- 2220 Woodland Blvd
- 2225 Woodland Blvd
- 8921 Dorchester St
- 8924 Dorchester St
- 8925 Ellington St
- 2200 Woodland Blvd
- 2207 Ivy Ave
- 2231 Woodland Blvd
- 8801 Chatham St
- 8823 Chatham St
- 2230 Ivy Ave
- 8930 Dorchester St
- 2230 Woodland Blvd
- 8931 Ellington St