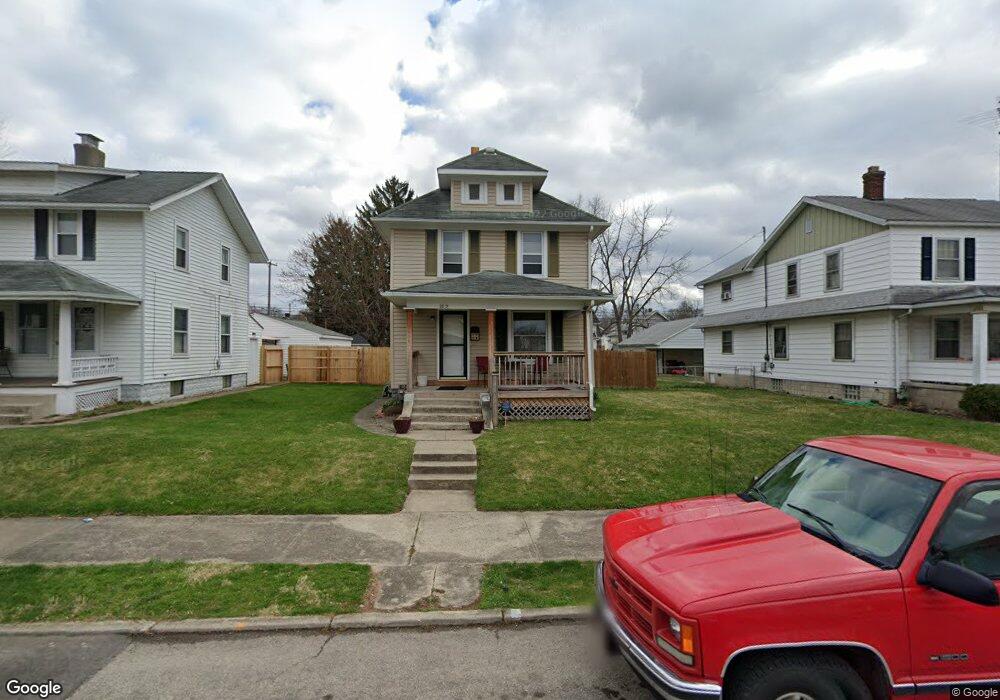
2213 Woodside Ave Springfield, OH 45503
Estimated Value: $140,021 - $148,000
2
Beds
1
Bath
1,000
Sq Ft
$145/Sq Ft
Est. Value
About This Home
This home is located at 2213 Woodside Ave, Springfield, OH 45503 and is currently estimated at $144,755, approximately $144 per square foot. 2213 Woodside Ave is a home located in Clark County with nearby schools including Warder Park-Wayne Elementary School, Schaefer Middle School, and Springfield High School.
Ownership History
Date
Name
Owned For
Owner Type
Purchase Details
Closed on
Dec 7, 2011
Sold by
Springleaf Financial Services Of Ohio In
Bought by
12 Oclock High Investments
Current Estimated Value
Purchase Details
Closed on
Sep 19, 2011
Sold by
Cupps Charles R
Bought by
American General Financial Services Inc
Purchase Details
Closed on
May 5, 2000
Sold by
Todhunter Julie M
Bought by
Cupps Charles R
Home Financials for this Owner
Home Financials are based on the most recent Mortgage that was taken out on this home.
Original Mortgage
$71,907
Interest Rate
8.26%
Mortgage Type
FHA
Purchase Details
Closed on
Jul 12, 1996
Sold by
Frances K Davis Est
Bought by
Todhunter Julie M
Home Financials for this Owner
Home Financials are based on the most recent Mortgage that was taken out on this home.
Original Mortgage
$46,000
Interest Rate
8.09%
Mortgage Type
New Conventional
Create a Home Valuation Report for This Property
The Home Valuation Report is an in-depth analysis detailing your home's value as well as a comparison with similar homes in the area
Home Values in the Area
Average Home Value in this Area
Purchase History
| Date | Buyer | Sale Price | Title Company |
|---|---|---|---|
| 12 Oclock High Investments | $26,900 | Attorney | |
| American General Financial Services Inc | $26,667 | Attorney | |
| Cupps Charles R | $72,500 | -- | |
| Todhunter Julie M | $48,500 | -- |
Source: Public Records
Mortgage History
| Date | Status | Borrower | Loan Amount |
|---|---|---|---|
| Previous Owner | Cupps Charles R | $71,907 | |
| Previous Owner | Todhunter Julie M | $46,000 |
Source: Public Records
Tax History Compared to Growth
Tax History
| Year | Tax Paid | Tax Assessment Tax Assessment Total Assessment is a certain percentage of the fair market value that is determined by local assessors to be the total taxable value of land and additions on the property. | Land | Improvement |
|---|---|---|---|---|
| 2024 | $1,649 | $33,380 | $5,580 | $27,800 |
| 2023 | $1,649 | $33,380 | $5,580 | $27,800 |
| 2022 | $1,689 | $33,380 | $5,580 | $27,800 |
| 2021 | $1,222 | $22,230 | $4,350 | $17,880 |
| 2020 | $1,224 | $22,230 | $4,350 | $17,880 |
| 2019 | $1,227 | $22,230 | $4,350 | $17,880 |
| 2018 | $1,183 | $20,560 | $2,720 | $17,840 |
| 2017 | $1,182 | $23,167 | $2,723 | $20,444 |
| 2016 | $1,183 | $23,167 | $2,723 | $20,444 |
| 2015 | $1,345 | $23,167 | $2,723 | $20,444 |
| 2014 | $1,339 | $23,167 | $2,723 | $20,444 |
| 2013 | $1,325 | $23,167 | $2,723 | $20,444 |
Source: Public Records
Map
Nearby Homes
- 2201 Woodside Ave
- 2256 Hillside Ave
- 415 Belleaire Ave
- 2020 Woodside Ave
- 320 N Clairmont Ave
- 319 Bellevue Ave
- 2149 Larch St
- 2226 Columbus Ave
- 2224-2226 Columbus Ave
- 325 N Burnett Rd
- 2210 Larch St
- 196 Belleaire Ave
- 127 Bellevue Ave
- 206-208 N Belmont Ave
- 402 Roseland Ave E
- 1721 Prospect St
- 1782 Edwards Ave
- 26 N Belmont Ave
- 112 N Burnett Rd
- 1634 Edwards Ave
- 2211 Woodside Ave
- 2217 Woodside Ave
- 2207 Woodside Ave
- 2225 Woodside Ave
- 2227 Woodside Ave
- 2216 Beatrice St
- 2210 Beatrice St
- 2220 Beatrice St
- 2224 Beatrice St
- 2206 Beatrice St
- 2229 Woodside Ave
- 2214 Woodside Ave
- 2220 Woodside Ave
- 2210 Woodside Ave
- 2300 Beatrice St
- 2200 Beatrice St
- 2224 Woodside Ave
- 2206 Woodside Ave
- 2233 Woodside Ave
- 2155 Woodside Ave