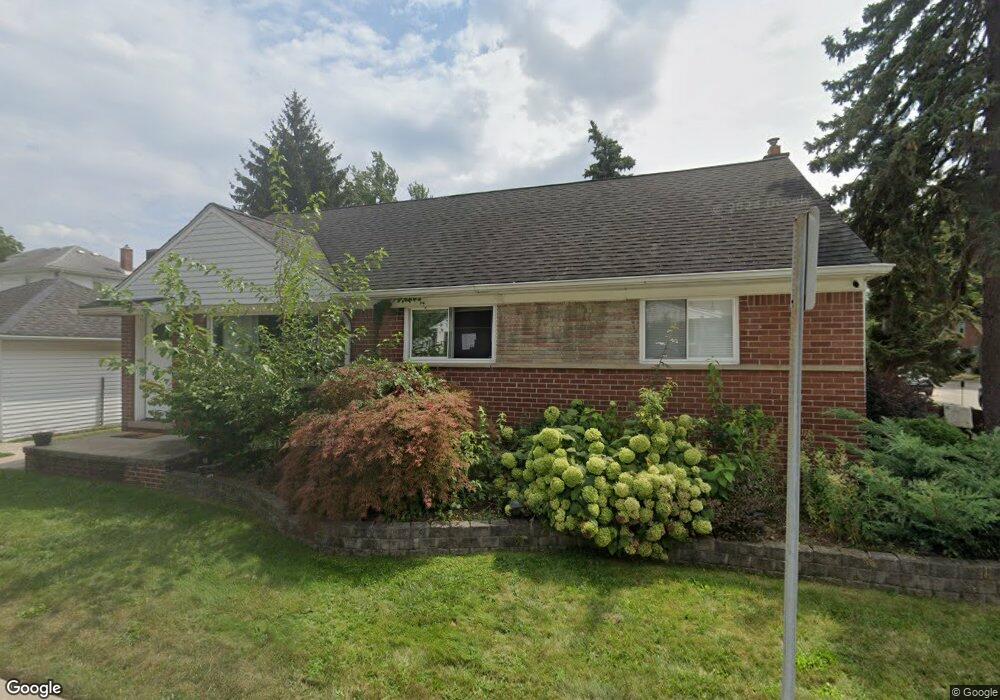
22131 Nona St Unit Bldg-Unit Dearborn, MI 48124
Ford Homes Historic District NeighborhoodEstimated Value: $241,000 - $294,134
2
Beds
2
Baths
1,040
Sq Ft
$254/Sq Ft
Est. Value
About This Home
This home is located at 22131 Nona St Unit Bldg-Unit, Dearborn, MI 48124 and is currently estimated at $264,534, approximately $254 per square foot. 22131 Nona St Unit Bldg-Unit is a home located in Wayne County with nearby schools including Duvall Elementary School, Smith Middle School, and Dearborn High School.
Ownership History
Date
Name
Owned For
Owner Type
Purchase Details
Closed on
Jan 23, 2018
Sold by
Eizein Rima Ali and Elzein Ali
Bought by
All B Elzein And Zeinab Eizein Fmtr
Current Estimated Value
Purchase Details
Closed on
Dec 15, 2017
Sold by
Zanddoulab Farideh
Bought by
Hider Sareen
Purchase Details
Closed on
Feb 1, 2017
Sold by
Hider Alyce J
Bought by
Hider Sareen
Purchase Details
Closed on
Oct 16, 2015
Sold by
Treasurer Of The Charter County Of Wayne
Bought by
Hider Alyce J
Purchase Details
Closed on
Nov 14, 2006
Sold by
Afshar Lelia
Bought by
Zanddoulab Farideh
Create a Home Valuation Report for This Property
The Home Valuation Report is an in-depth analysis detailing your home's value as well as a comparison with similar homes in the area
Home Values in the Area
Average Home Value in this Area
Purchase History
| Date | Buyer | Sale Price | Title Company |
|---|---|---|---|
| All B Elzein And Zeinab Eizein Fmtr | -- | Venture Title Agency | |
| Elzein Rima Ali | $125,000 | Venture Title Agency | |
| Hider Sareen | -- | None Available | |
| Hider Sareen | -- | None Available | |
| Hider Alyce J | $73,000 | None Available | |
| Zanddoulab Farideh | -- | Minnesota Title Agency |
Source: Public Records
Tax History Compared to Growth
Tax History
| Year | Tax Paid | Tax Assessment Tax Assessment Total Assessment is a certain percentage of the fair market value that is determined by local assessors to be the total taxable value of land and additions on the property. | Land | Improvement |
|---|---|---|---|---|
| 2025 | $3,339 | $126,700 | $0 | $0 |
| 2024 | $3,339 | $124,200 | $0 | $0 |
| 2023 | $3,160 | $107,400 | $0 | $0 |
| 2022 | $3,556 | $89,400 | $0 | $0 |
| 2021 | $4,132 | $79,500 | $0 | $0 |
| 2019 | $4,090 | $64,800 | $0 | $0 |
| 2018 | $3,215 | $61,500 | $0 | $0 |
| 2017 | $922 | $59,200 | $0 | $0 |
| 2016 | $3,915 | $57,800 | $0 | $0 |
| 2015 | $5,667 | $66,300 | $0 | $0 |
| 2013 | $5,490 | $54,900 | $0 | $0 |
| 2011 | -- | $60,350 | $0 | $0 |
Source: Public Records
Map
Nearby Homes
- 1 W Village Ln Unit 48
- 22264 Abbey Ln Unit 24
- 22448 Nona St
- 22350 Military St
- 22223 Military St
- 22620 Newman St
- 21514 Homer St
- 22101 Francis St
- 824 Mason St
- 21514 Francis St
- 22200 Gregory St
- 23323 Park St
- 21800 Morley Ave Unit 1104
- 21800 Morley Ave Unit 116
- 21800 Morley Ave Unit 211
- 21800 Morley Ave Unit 104
- 21800 Morley Ave Unit 601
- 830 S Brady Rd
- 718 S Military St
- 22651 Garrison St
- 22131 Nona St
- 1317 May St
- 0 Undisclosed Unit 210051388
- 0 S Telegraph Unit 216077061
- 0 Michigan Unit 218065110
- 192 Carl St
- 0 Outer Dr Unit 218030077
- 0 Undisclosed Unit 217111003
- 0 Outer Dr Unit 4921807
- 0 Undisclosed Unit 5593377
- 0 Outer Dr Unit 214042248
- 0 Undisclosed Unit 217042649
- 0 Undisclosed Unit R217098899
- 0 Michigan Unit R218116269
- 0 Outer Dr Unit R219057588
- 0 Outer Dr Unit R2200085436
- 0 Outer Dr Unit R2200085440
- 0 Outer Dr Unit R2210019074
- 0 Outer Dr Unit R2210052756
- 0 Outer Dr Unit R2210084863