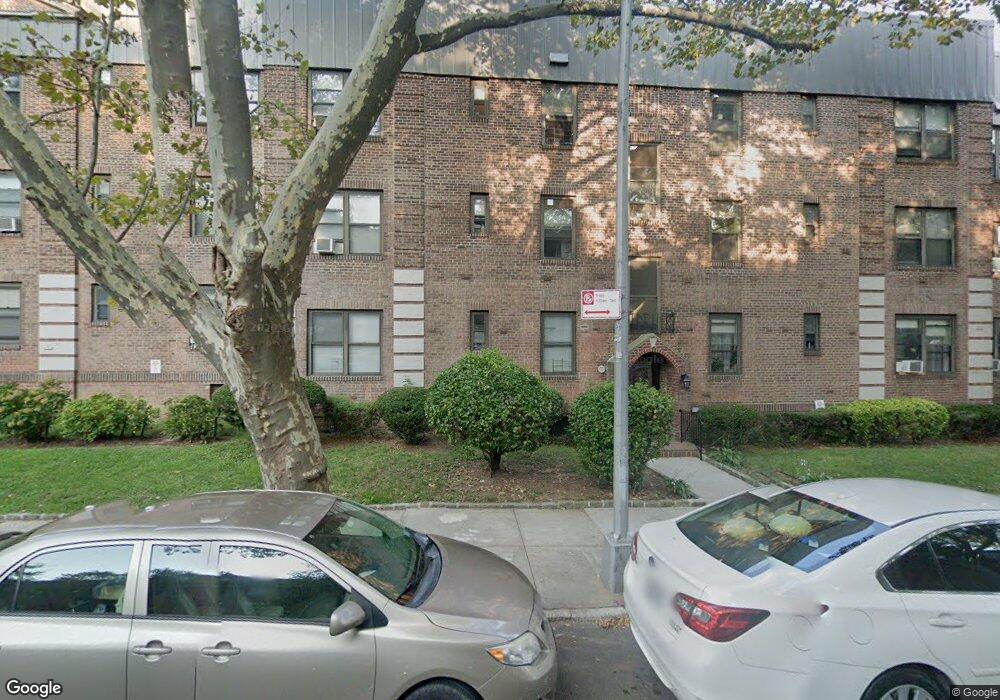
2214 76th St Unit A1 East Elmhurst, NY 11370
Ditmars Steinway NeighborhoodEstimated Value: $285,000 - $450,000
--
Bed
--
Bath
677
Sq Ft
$578/Sq Ft
Est. Value
About This Home
This home is located at 2214 76th St Unit A1, East Elmhurst, NY 11370 and is currently estimated at $391,615, approximately $578 per square foot. 2214 76th St Unit A1 is a home located in Queens County with nearby schools including P.S. 2 Alfred Zimberg, Is 141 The Steinway, and William Cullen Bryant High School.
Ownership History
Date
Name
Owned For
Owner Type
Purchase Details
Closed on
Dec 22, 2010
Sold by
Bentancur Jose and Palacio Luz Stella
Bought by
Ahmed Adnan
Current Estimated Value
Home Financials for this Owner
Home Financials are based on the most recent Mortgage that was taken out on this home.
Original Mortgage
$223,200
Outstanding Balance
$148,586
Interest Rate
4.37%
Mortgage Type
Purchase Money Mortgage
Estimated Equity
$243,029
Purchase Details
Closed on
Jun 12, 2006
Sold by
Debra Kramer As Chapter 7 Trustee
Bought by
Alvarez Doris R
Home Financials for this Owner
Home Financials are based on the most recent Mortgage that was taken out on this home.
Original Mortgage
$189,600
Interest Rate
6.59%
Mortgage Type
Purchase Money Mortgage
Purchase Details
Closed on
Dec 21, 2001
Sold by
Wasik Steve S
Bought by
Hart Michael
Home Financials for this Owner
Home Financials are based on the most recent Mortgage that was taken out on this home.
Original Mortgage
$137,750
Interest Rate
6.85%
Create a Home Valuation Report for This Property
The Home Valuation Report is an in-depth analysis detailing your home's value as well as a comparison with similar homes in the area
Home Values in the Area
Average Home Value in this Area
Purchase History
| Date | Buyer | Sale Price | Title Company |
|---|---|---|---|
| Ahmed Adnan | $279,000 | -- | |
| Alvarez Doris R | $237,000 | -- | |
| Hart Michael | -- | -- |
Source: Public Records
Mortgage History
| Date | Status | Borrower | Loan Amount |
|---|---|---|---|
| Open | Ahmed Adnan | $223,200 | |
| Previous Owner | Alvarez Doris R | $189,600 | |
| Previous Owner | Hart Michael | $137,750 |
Source: Public Records
Tax History Compared to Growth
Tax History
| Year | Tax Paid | Tax Assessment Tax Assessment Total Assessment is a certain percentage of the fair market value that is determined by local assessors to be the total taxable value of land and additions on the property. | Land | Improvement |
|---|---|---|---|---|
| 2025 | $3,617 | $31,551 | $6,212 | $25,339 |
| 2024 | $2,616 | $31,252 | $6,212 | $25,040 |
| 2023 | $3,595 | $31,075 | $6,212 | $24,863 |
| 2022 | $2,524 | $31,228 | $6,212 | $25,016 |
| 2021 | $2,345 | $28,955 | $6,212 | $22,743 |
| 2020 | $2,337 | $32,113 | $6,212 | $25,901 |
| 2019 | $2,163 | $31,665 | $6,212 | $25,453 |
| 2018 | $2,725 | $23,755 | $6,212 | $17,543 |
| 2017 | $2,455 | $21,021 | $6,213 | $14,808 |
| 2016 | $2,239 | $21,021 | $6,213 | $14,808 |
| 2015 | $1,194 | $18,473 | $6,213 | $12,260 |
| 2014 | $1,194 | $17,226 | $6,212 | $11,014 |
Source: Public Records
Map
Nearby Homes
- 2208 76th St Unit A3
- 2209 76th St Unit C2
- 22-27 76 St Unit B2
- 76-12 Ditmars Blvd Unit B3
- 22-28 77th St Unit C1
- 2230 75th St
- 22-31 77th St Unit C2
- 22-39 74th St
- 2220 78th St Unit A3
- 22-26 74th St
- 21-40 78th St Unit 2
- 22-39 78 St
- 2134 74th St
- 21-16 77 Street 2nd Floor
- 70-07 Ditmars Blvd
- 2255 78th St Unit 2E
- 2144 73rd St
- 21-38 73rd St
- 22-60 79th St Unit 1A
- 22-40 80th St Unit 2B
- 2214 76th St Unit C3
- 2214 76th St Unit B3
- 2214 76th St Unit A3
- 2214 76th St Unit C2
- 2214 76th St Unit B2
- 2214 76th St Unit A2
- 2214 76th St Unit C1
- 2214 76th St Unit B1
- 22-14 76th St Unit A2
- 2214 76th St Unit 22-14
- 2208 76th St Unit D3
- 2208 76th St Unit C3
- 2208 76th St Unit B3
- 2208 76th St Unit D2
- 2208 76th St Unit C2
- 2208 76th St Unit B2
- 2208 76th St Unit A2
- 2208 76th St Unit D1
- 2208 76th St Unit C1
- 2208 76th St Unit B1