Estimated Value: $127,155 - $165,000
--
Bed
1
Bath
850
Sq Ft
$167/Sq Ft
Est. Value
About This Home
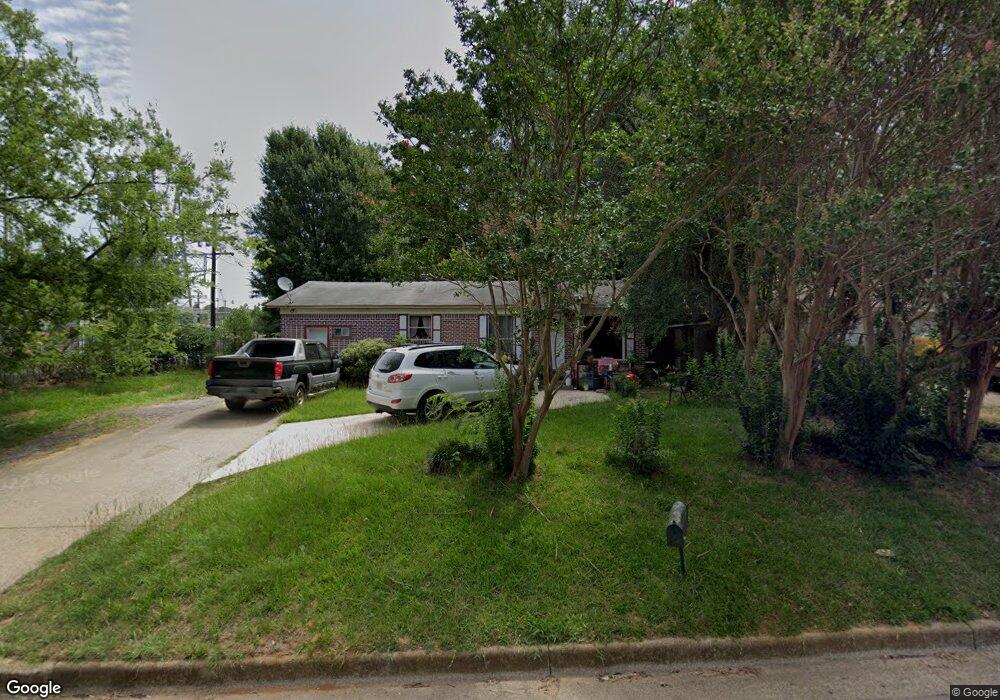
This home is located at 2214 Old Omen Rd, Tyler, TX 75701 and is currently estimated at $142,039, approximately $167 per square foot. 2214 Old Omen Rd is a home located in Smith County with nearby schools including Kissam Intermediate School, Jackson Elementary School, and Chapel Hill Middle School.
Ownership History
Date
Name
Owned For
Owner Type
Purchase Details
Closed on
Mar 12, 2019
Sold by
Compton J C
Bought by
Martinez Gilberto and Barajas Ruth
Current Estimated Value
Home Financials for this Owner
Home Financials are based on the most recent Mortgage that was taken out on this home.
Original Mortgage
$118,000
Outstanding Balance
$103,320
Interest Rate
4.4%
Mortgage Type
Purchase Money Mortgage
Estimated Equity
$38,719
Purchase Details
Closed on
Jul 9, 2018
Sold by
Barajas Maria V
Bought by
Dsouza Francisca Calderon
Purchase Details
Closed on
Aug 31, 2011
Sold by
Bbb Ranch Construction Inc
Bought by
Dsouza Francisca Calderon
Home Financials for this Owner
Home Financials are based on the most recent Mortgage that was taken out on this home.
Original Mortgage
$83,333
Interest Rate
4.53%
Mortgage Type
Seller Take Back
Purchase Details
Closed on
Aug 13, 2008
Sold by
Halligan Frank B and Halligan Helen J
Bought by
Bbb Ranch Construction Inc
Create a Home Valuation Report for This Property
The Home Valuation Report is an in-depth analysis detailing your home's value as well as a comparison with similar homes in the area
Home Values in the Area
Average Home Value in this Area
Purchase History
| Date | Buyer | Sale Price | Title Company |
|---|---|---|---|
| Martinez Gilberto | -- | None Available | |
| Dsouza Francisca Calderon | -- | None Available | |
| Dsouza Francisca Calderon | -- | None Available | |
| Bbb Ranch Construction Inc | -- | None Available |
Source: Public Records
Mortgage History
| Date | Status | Borrower | Loan Amount |
|---|---|---|---|
| Open | Martinez Gilberto | $118,000 | |
| Previous Owner | Dsouza Francisca Calderon | $83,333 |
Source: Public Records
Tax History Compared to Growth
Tax History
| Year | Tax Paid | Tax Assessment Tax Assessment Total Assessment is a certain percentage of the fair market value that is determined by local assessors to be the total taxable value of land and additions on the property. | Land | Improvement |
|---|---|---|---|---|
| 2025 | $608 | $115,510 | $27,673 | $87,837 |
| 2024 | $608 | $80,197 | $14,261 | $97,687 |
| 2023 | $1,377 | $113,148 | $14,261 | $98,887 |
| 2022 | $1,193 | $103,639 | $10,933 | $92,706 |
| 2021 | $1,141 | $66,378 | $10,933 | $55,445 |
| 2020 | $1,069 | $65,099 | $10,933 | $54,166 |
| 2019 | $1,002 | $55,796 | $9,507 | $46,289 |
| 2018 | $905 | $45,268 | $7,592 | $37,676 |
| 2017 | $905 | $45,268 | $7,592 | $37,676 |
| 2016 | $902 | $45,087 | $7,592 | $37,495 |
| 2015 | $707 | $43,633 | $7,592 | $36,041 |
| 2014 | $707 | $45,355 | $7,592 | $37,763 |
Source: Public Records
Map
Nearby Homes
- 2216 Gish Ln
- 2033 Old Omen Rd
- 3205 Timberlane Dr
- 3401 Omega Dr
- 3027 Brentwood Dr
- 1835 Melba Dr
- 3014 Brentwood Dr
- 3020 Meadowlark Ln
- 2019 Woodhaven Dr
- 2613 Chelsea Dr
- 3108 Williamsburg Cir
- 2527 Westminster Dr
- 2936 Rollingwood Dr
- 2110 Crestwood Dr
- 2523 Shenandoah Dr
- 2103 Crestwood Dr
- 3109 Campus Cir
- 2909 Meadowlark Ln
- 3913 Belle Mere St
- 2931 Meadow Brook Trail
- 2218 Old Omen Rd
- 2201 Gish Ln
- 2222 Old Omen Rd
- 2207 Gish Ln
- 2211 Gish Ln
- 2228 Old Omen Rd
- 2228 2228 Old Omen Rd
- 3321 Sandalwood Ln
- 3322 Brooks Ln
- 3321 3321 Sandalwood Ln
- 2219 Gish Ln
- 2304 Old Omen Rd
- 3502 Betts St
- 2304 2304 Old Omen Rd
- 3310 Brooks Ln
- 3311 Sandalwood Ln
- 2216 2216 Gish Ln
- 2227 Gish Ln
- 3506 Betts St
- 2310 Old Omen Rd