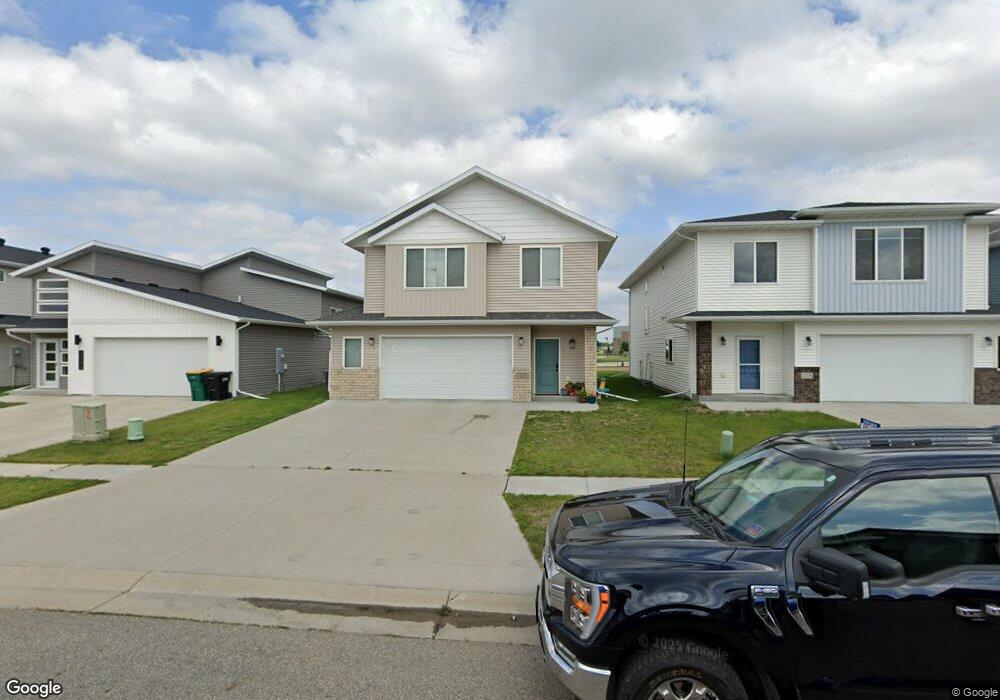
2215 10th Ct W West Fargo, ND 58078
Brooks Harbor NeighborhoodEstimated Value: $354,000 - $378,609
3
Beds
3
Baths
2,173
Sq Ft
$169/Sq Ft
Est. Value
About This Home
This home is located at 2215 10th Ct W, West Fargo, ND 58078 and is currently estimated at $366,305, approximately $168 per square foot. 2215 10th Ct W is a home located in Cass County with nearby schools including Brooks Harbor Elementary School, Liberty Middle School, and West Fargo Sheyenne High School.
Ownership History
Date
Name
Owned For
Owner Type
Purchase Details
Closed on
Jan 13, 2021
Sold by
Facey Rhoda A and Facey Ryan J
Bought by
Kriefall Daniel Kinney and Kriefall Sara Rose
Current Estimated Value
Home Financials for this Owner
Home Financials are based on the most recent Mortgage that was taken out on this home.
Original Mortgage
$270,115
Interest Rate
3.05%
Mortgage Type
New Conventional
Purchase Details
Closed on
Oct 28, 2019
Sold by
Dabbert Custom Homes Llc
Bought by
Facey Rhoda A and Hunter Ryan J
Home Financials for this Owner
Home Financials are based on the most recent Mortgage that was taken out on this home.
Original Mortgage
$260,101
Interest Rate
3.37%
Mortgage Type
FHA
Create a Home Valuation Report for This Property
The Home Valuation Report is an in-depth analysis detailing your home's value as well as a comparison with similar homes in the area
Home Values in the Area
Average Home Value in this Area
Purchase History
| Date | Buyer | Sale Price | Title Company |
|---|---|---|---|
| Kriefall Daniel Kinney | -- | New Title Company Name | |
| Kriefall Daniel Kinney | $303,500 | New Title Company Name | |
| Facey Rhoda A | $264,900 | Title Co |
Source: Public Records
Mortgage History
| Date | Status | Borrower | Loan Amount |
|---|---|---|---|
| Previous Owner | Kriefall Daniel Kinney | $270,115 | |
| Previous Owner | Facey Rhoda A | $260,101 |
Source: Public Records
Tax History Compared to Growth
Tax History
| Year | Tax Paid | Tax Assessment Tax Assessment Total Assessment is a certain percentage of the fair market value that is determined by local assessors to be the total taxable value of land and additions on the property. | Land | Improvement |
|---|---|---|---|---|
| 2024 | $5,654 | $174,150 | $25,250 | $148,900 |
| 2023 | $5,983 | $167,050 | $25,250 | $141,800 |
| 2022 | $5,722 | $153,900 | $25,250 | $128,650 |
| 2021 | $3,421 | $69,000 | $20,650 | $48,350 |
| 2020 | $3,268 | $64,000 | $20,650 | $43,350 |
| 2019 | $2,544 | $35,950 | $20,650 | $15,300 |
| 2018 | $1,985 | $14,450 | $14,450 | $0 |
| 2017 | $1,938 | $14,450 | $14,450 | $0 |
| 2016 | $1,073 | $3,050 | $3,050 | $0 |
Source: Public Records
Map
Nearby Homes
- 2216 10th Ct W
- 2170 Dock Dr
- 2101 10th St W
- 713 23rd Ave W
- 1043 Barnes Dr W
- 1029 Highland Ln W
- 1220 Legion Ln W
- 2124 14th St W
- 1127 24th Ave W
- 1326 Commander Dr W
- 1179 Highland Ln W
- 1234 Highland Ln W
- 2728 Westwood St W
- 2427 Harbor Ln
- 2733 Divide St W
- 2737 10th St W
- 2735 11th St W
- 2734 12th St W
- 2704 14th St W
- 939 Eaglewood Ave
- 2223 10th Ct W
- 2207 10th Ct W
- 2203 10th Ct W
- 2231 10th Ct W
- 2235 10th Ct W
- 2212 10th Ct W
- 2220 10th Ct W
- 2208 10th Ct W
- 2161 10th St W
- 2204 10th Ct W
- 2239 10th Ct W
- 2157 10th St W
- 2232 10th Ct W
- 2162 10th St W
- 2243 10th Ct W
- 2153 10th St W
- 2158 10th St W
- 2236 10th Ct W
- 1051 22nd Ave W
- 2149 10th St W