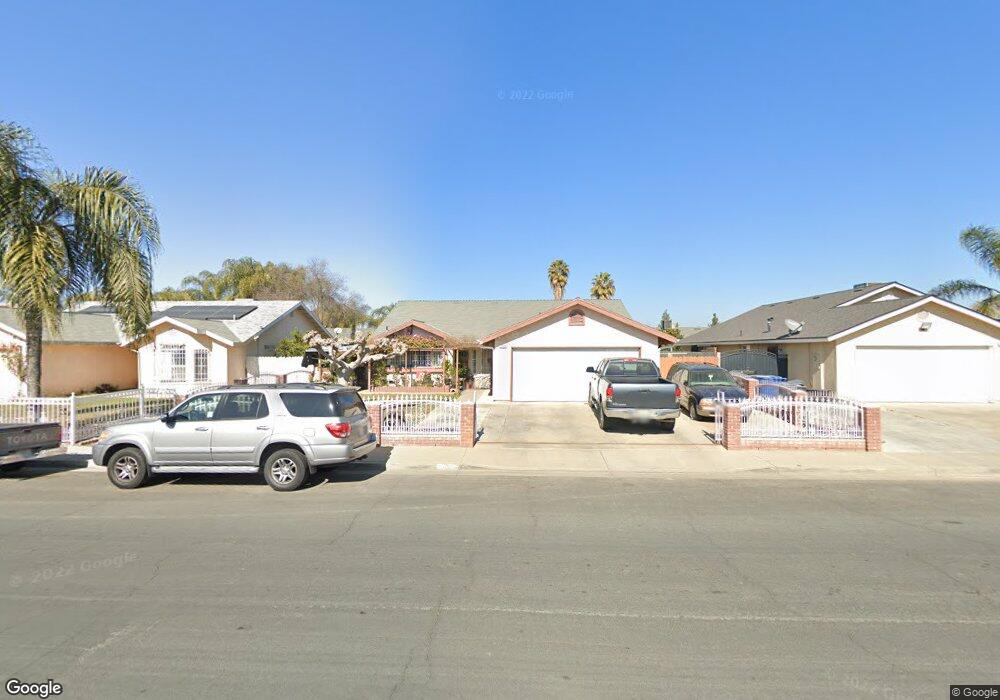
2215 16th Place Delano, CA 93215
East Delano NeighborhoodEstimated Value: $329,000 - $392,000
About This Home
This home is located at 2215 16th Place, Delano, CA 93215 and is currently estimated at $355,572, approximately $239 per square foot. 2215 16th Place is a home located in Kern County with nearby schools including Harvest Elementary School, La Vina Middle School, and Delano High School.
Ownership History
We collect this data history from publicly available records. To have your information removed, we recommend requesting removal directly through your county’s website.
Purchase Details
Home Financials for this Owner
Home Financials are based on the most recent Mortgage that was taken out on this home.Home Values in the Area
Average Home Value in this Area
Purchase History
We collect this data history from publicly available records. To have your information removed, we recommend requesting removal directly through your county’s website.
| Date | Buyer | Sale Price | Title Company |
|---|---|---|---|
| $92,000 | Commonwealth Land Title Co |
Mortgage History
We collect this data history from publicly available records. To have your information removed, we recommend requesting removal directly through your county’s website.
| Date | Status | Borrower | Loan Amount |
|---|---|---|---|
| Previous Owner | $90,849 |
Tax History
We collect this data history from publicly available records. To have your information removed, we recommend requesting removal directly through your county’s website.
| Year | Tax Paid | Tax Assessment Tax Assessment Total Assessment is a certain percentage of the fair market value that is determined by local assessors to be the total taxable value of land and additions on the property. | Land | Improvement |
|---|---|---|---|---|
| 2025 | $1,969 | $153,486 | $33,576 | $119,910 |
| 2024 | $1,917 | $150,477 | $32,918 | $117,559 |
| 2023 | $1,917 | $147,527 | $32,273 | $115,254 |
| 2022 | $1,886 | $144,636 | $31,641 | $112,995 |
| 2021 | $1,815 | $141,801 | $31,021 | $110,780 |
| 2020 | $1,813 | $140,348 | $30,703 | $109,645 |
| 2019 | $1,784 | $140,348 | $30,703 | $109,645 |
| 2018 | $1,762 | $134,900 | $29,511 | $105,389 |
| 2017 | $1,773 | $132,256 | $28,933 | $103,323 |
| 2016 | $1,746 | $129,664 | $28,366 | $101,298 |
| 2015 | $1,802 | $127,717 | $27,940 | $99,777 |
| 2014 | $1,689 | $125,216 | $27,393 | $97,823 |
Map
- 2107 19th Ave
- 0 Cecil Ave
- 1835 Blossom Ave
- 1611 16th Place
- 2015 Romolo St
- 2014 Rounds St
- 1817 8th Ave
- 1519 12th Ave
- 2617 Sillano Dr
- 2163 Mission St Unit FW207
- 2209 Ruffino Ct
- 701 Salem St
- 1518 9th Ave
- 1519 7th Place
- 1820 5th Place
- 2334 Rounds St
- 1222 9th Ave
- 2102 Norwalk St
- 1115 Lexington St
- 601 11th Ave
Ask me questions while you tour the home.