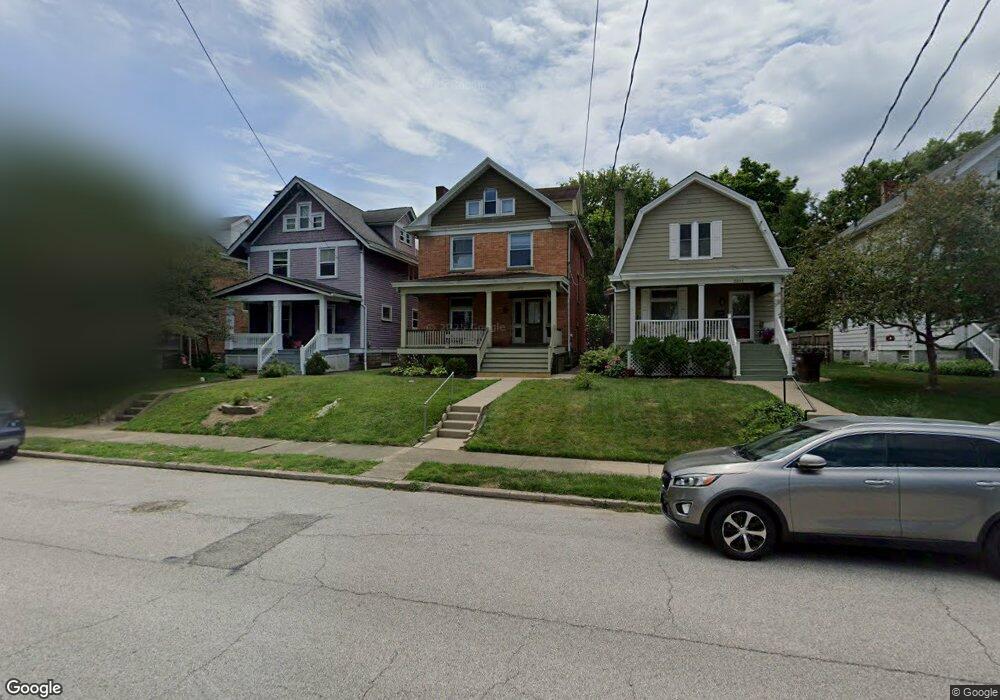
2215 Cleneay Ave Cincinnati, OH 45212
Estimated Value: $314,000 - $391,000
3
Beds
1
Bath
1,440
Sq Ft
$240/Sq Ft
Est. Value
About This Home
This home is located at 2215 Cleneay Ave, Cincinnati, OH 45212 and is currently estimated at $345,733, approximately $240 per square foot. 2215 Cleneay Ave is a home located in Hamilton County with nearby schools including Norwood High School, Alliance Academy of Cincinnati, and Cornerstone Christian Academy.
Ownership History
Date
Name
Owned For
Owner Type
Purchase Details
Closed on
Feb 22, 2006
Sold by
Zimmerman Erik D and Irwin Julie M
Bought by
Ez Property Management Llc
Current Estimated Value
Purchase Details
Closed on
Sep 30, 1999
Sold by
Clew Bay Properties Ltd
Bought by
Zimmerman Erik D and Zimmerman Julie M
Home Financials for this Owner
Home Financials are based on the most recent Mortgage that was taken out on this home.
Original Mortgage
$83,300
Interest Rate
7.93%
Purchase Details
Closed on
May 6, 1997
Sold by
Mcging Michael C and Mcging Diana L
Bought by
Clew Bay Properties Ltd
Purchase Details
Closed on
Apr 15, 1997
Sold by
Brookshire Gayle
Bought by
Mcging Michael C
Purchase Details
Closed on
Jul 31, 1996
Sold by
Corney Martha
Bought by
Brookshire Gayle and Martha Corney Trust
Create a Home Valuation Report for This Property
The Home Valuation Report is an in-depth analysis detailing your home's value as well as a comparison with similar homes in the area
Home Values in the Area
Average Home Value in this Area
Purchase History
| Date | Buyer | Sale Price | Title Company |
|---|---|---|---|
| Ez Property Management Llc | -- | None Available | |
| Zimmerman Erik D | $81,000 | -- | |
| Clew Bay Properties Ltd | -- | -- | |
| Mcging Michael C | $75,000 | -- | |
| Brookshire Gayle | -- | -- | |
| Corney Martha | -- | -- |
Source: Public Records
Mortgage History
| Date | Status | Borrower | Loan Amount |
|---|---|---|---|
| Previous Owner | Zimmerman Erik D | $83,300 |
Source: Public Records
Tax History Compared to Growth
Tax History
| Year | Tax Paid | Tax Assessment Tax Assessment Total Assessment is a certain percentage of the fair market value that is determined by local assessors to be the total taxable value of land and additions on the property. | Land | Improvement |
|---|---|---|---|---|
| 2024 | $3,774 | $70,788 | $20,482 | $50,306 |
| 2023 | $3,794 | $70,788 | $20,482 | $50,306 |
| 2022 | $2,931 | $46,050 | $9,289 | $36,761 |
| 2021 | $2,905 | $46,050 | $9,289 | $36,761 |
| 2020 | $2,841 | $46,050 | $9,289 | $36,761 |
| 2019 | $2,709 | $40,394 | $8,148 | $32,246 |
| 2018 | $2,711 | $40,394 | $8,148 | $32,246 |
| 2017 | $2,593 | $40,394 | $8,148 | $32,246 |
| 2016 | $2,658 | $39,550 | $8,148 | $31,402 |
| 2015 | $2,348 | $39,550 | $8,148 | $31,402 |
| 2014 | $2,339 | $39,550 | $8,148 | $31,402 |
| 2013 | $2,314 | $39,550 | $8,148 | $31,402 |
Source: Public Records
Map
Nearby Homes
- 3736 Elsmere Ave
- 3824 Elsmere Ave
- 2110 Cleneay Ave
- 3756 Regent Ave
- 3752 Regent Ave
- 3810 Regent Ave
- 3950 Elsmere Ave
- 2418 Morton Ave
- 3954 Spencer Ave
- 3912 Lindley Ave
- 3575 Potomac Ave
- 3618 Wabash Ave
- 3935 Lindley Ave
- 2014 Clarion Ave
- 3923 S Madison Ave
- 3600 Tamarack Ave
- 2002 Clarion Ave
- 2235 Crane Ave
- 2127 Slane Ave
- 2119 Slane Ave
- 2217 Cleneay Ave
- 2211 Cleneay Ave
- 2219 Cleneay Ave
- 2209 Cleneay Ave
- 3749 Hazel Ave
- 2223 Cleneay Ave
- 2205 Cleneay Ave
- 3752 Elsmere Ave
- 3747 Hazel Ave
- 2201 Cleneay Ave
- 3748 Elsmere Ave
- 3803 Hazel Ave
- 3743 Hazel Ave
- 3800 Elsmere Ave
- 3744 Elsmere Ave
- 3805 Hazel Ave
- 2227 Cleneay Ave
- 3739 Hazel Ave
- 3804 Elsmere Ave
- 3809 Hazel Ave