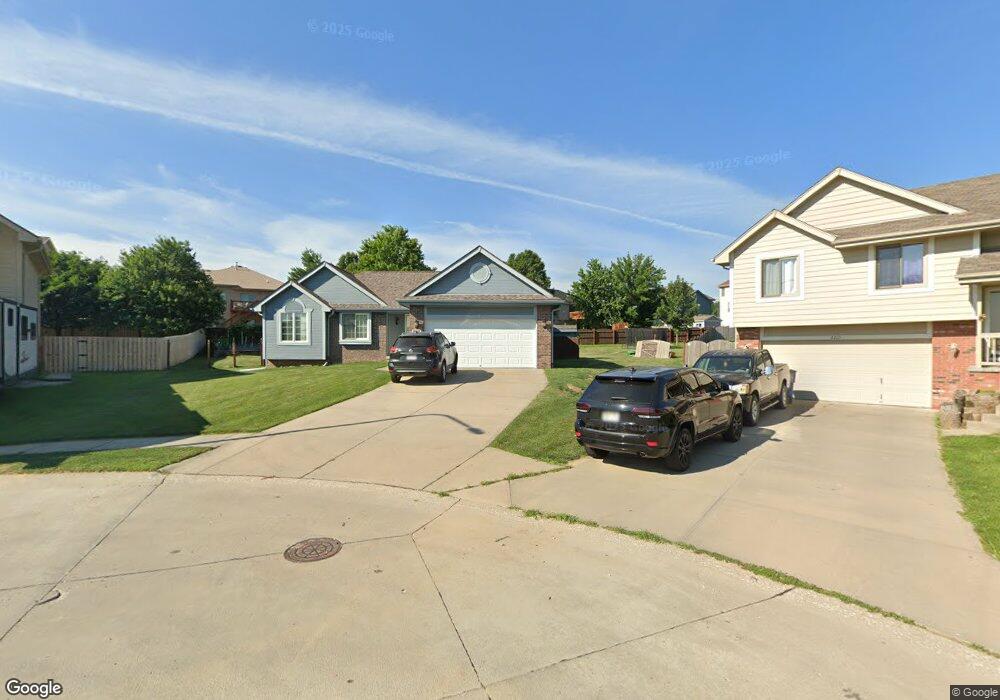
2215 Kara Cir Papillion, NE 68133
Estimated Value: $310,487 - $360,000
3
Beds
3
Baths
1,408
Sq Ft
$236/Sq Ft
Est. Value
About This Home
This home is located at 2215 Kara Cir, Papillion, NE 68133 and is currently estimated at $332,872, approximately $236 per square foot. 2215 Kara Cir is a home located in Sarpy County with nearby schools including Pawnee Elementary School, Bryan Middle School, and Bryan High School.
Ownership History
Date
Name
Owned For
Owner Type
Purchase Details
Closed on
Aug 31, 2011
Sold by
Arch By Holdings Llc Series 2010 A
Bought by
Kadner John T and Kadner Jennifer A
Current Estimated Value
Home Financials for this Owner
Home Financials are based on the most recent Mortgage that was taken out on this home.
Original Mortgage
$128,800
Outstanding Balance
$89,331
Interest Rate
4.53%
Estimated Equity
$243,541
Purchase Details
Closed on
Apr 18, 2011
Sold by
West Sarah J
Bought by
Arch Bay Holdings Llc Series 2010A
Purchase Details
Closed on
Jun 1, 2007
Sold by
West Aaron J
Bought by
West Sarah J
Purchase Details
Closed on
Aug 18, 2006
Sold by
Rogers Construction Inc
Bought by
West Aaron J and West Sarah J
Home Financials for this Owner
Home Financials are based on the most recent Mortgage that was taken out on this home.
Original Mortgage
$184,144
Interest Rate
6.75%
Create a Home Valuation Report for This Property
The Home Valuation Report is an in-depth analysis detailing your home's value as well as a comparison with similar homes in the area
Home Values in the Area
Average Home Value in this Area
Purchase History
| Date | Buyer | Sale Price | Title Company |
|---|---|---|---|
| Kadner John T | $161,000 | Insight Title | |
| Arch Bay Holdings Llc Series 2010A | $131,000 | None Available | |
| West Sarah J | -- | None Available | |
| West Aaron J | $186,000 | Btc | |
| Rogers Construction Inc | $33,000 | Btc |
Source: Public Records
Mortgage History
| Date | Status | Borrower | Loan Amount |
|---|---|---|---|
| Open | Kadner John T | $128,800 | |
| Previous Owner | West Aaron J | $184,144 |
Source: Public Records
Tax History Compared to Growth
Tax History
| Year | Tax Paid | Tax Assessment Tax Assessment Total Assessment is a certain percentage of the fair market value that is determined by local assessors to be the total taxable value of land and additions on the property. | Land | Improvement |
|---|---|---|---|---|
| 2025 | $5,010 | $270,926 | $51,000 | $219,926 |
| 2024 | $5,748 | $267,978 | $51,000 | $216,978 |
| 2023 | $5,748 | $245,980 | $49,000 | $196,980 |
| 2022 | $5,086 | $215,216 | $46,000 | $169,216 |
| 2021 | $4,956 | $207,981 | $46,000 | $161,981 |
| 2020 | $4,840 | $202,242 | $46,000 | $156,242 |
| 2019 | $4,608 | $193,166 | $46,000 | $147,166 |
| 2018 | $4,489 | $186,457 | $46,000 | $140,457 |
| 2017 | $4,219 | $174,477 | $46,000 | $128,477 |
| 2016 | $4,298 | $167,932 | $35,000 | $132,932 |
| 2015 | $4,178 | $160,724 | $33,000 | $127,724 |
| 2014 | $4,212 | $157,524 | $33,000 | $124,524 |
| 2012 | -- | $157,497 | $33,000 | $124,497 |
Source: Public Records
Map
Nearby Homes
- 605 Ruby Rd
- 2110 Aberdeen Plaza
- 401 Castle Pine Dr
- 611 Rosewood Ave
- 2115 Skyhawk Ave
- 6211 Harvest Dr
- 6215 Harvest Dr
- 6219 Harvest Dr
- 2608 Alexandra Rd
- 703 Tupelo Ln
- 6223 Harvest Dr
- 6216 Harvest Dr
- 6227 Harvest Dr
- 9115 Alexandra Rd
- 6220 Harvest Dr
- 2004 Windcrest Ave
- 6313 Harvest Dr
- 2107 John St
- 6437 Clear Creek St
- Reagan Plan at Pioneer View
- 2213 Kara Cir
- 2212 Aberdeen Dr
- 2214 Aberdeen Dr
- 2217 Kara Cir
- 2210 Aberdeen Dr
- 2211 Kara Cir
- 2302 Aberdeen Dr
- 2219 Kara Cir
- 605 Castle Pine Dr
- 603 Castle Pine Dr
- 607 Castle Pine Dr
- 601 Castle Pine Dr
- 2304 Aberdeen Dr
- 2301 Kara Dr
- 2209 Kara Dr
- 609 Castle Pine Dr
- 2207 Kara Dr
- 608 Ruby Rd
- 2213 Aberdeen Dr
- 606 Ruby Rd