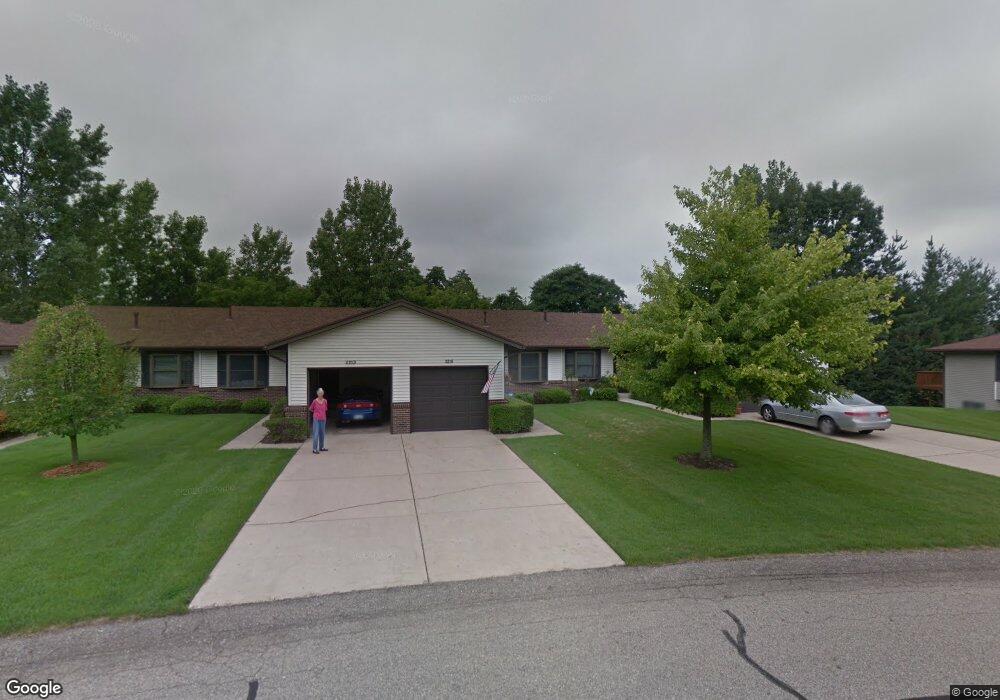
2215 Mapleton St NE Grand Rapids, MI 49505
Creston NeighborhoodEstimated Value: $266,000 - $299,000
2
Beds
2
Baths
1,072
Sq Ft
$264/Sq Ft
Est. Value
About This Home
This home is located at 2215 Mapleton St NE, Grand Rapids, MI 49505 and is currently estimated at $283,077, approximately $264 per square foot. 2215 Mapleton St NE is a home located in Kent County with nearby schools including Riverside Middle School, Union High School, and Knapp Charter Academy.
Ownership History
Date
Name
Owned For
Owner Type
Purchase Details
Closed on
Jan 31, 2018
Sold by
Brook Tammi L
Bought by
Craib Terri Jean
Current Estimated Value
Purchase Details
Closed on
Mar 8, 2017
Sold by
Pupel Diane M
Bought by
Brook Tammi L
Home Financials for this Owner
Home Financials are based on the most recent Mortgage that was taken out on this home.
Original Mortgage
$160,146
Interest Rate
4.19%
Mortgage Type
New Conventional
Purchase Details
Closed on
Feb 25, 2013
Sold by
Stoddard Anne M and Donna M Oleniczak Trust
Bought by
Pupel Diane M
Home Financials for this Owner
Home Financials are based on the most recent Mortgage that was taken out on this home.
Original Mortgage
$85,500
Interest Rate
3.49%
Mortgage Type
New Conventional
Purchase Details
Closed on
Feb 24, 2006
Sold by
Mcgee Donna Oleniczak and Mcgee John F
Bought by
Oleniczak Donna M and Donna M Oleniczak Trust
Purchase Details
Closed on
Sep 29, 1995
Sold by
Ctry Aire and Ctry Mcgee J
Bought by
Pupel Mcgee J and Pupel Diane M
Create a Home Valuation Report for This Property
The Home Valuation Report is an in-depth analysis detailing your home's value as well as a comparison with similar homes in the area
Home Values in the Area
Average Home Value in this Area
Purchase History
| Date | Buyer | Sale Price | Title Company |
|---|---|---|---|
| Craib Terri Jean | $174,500 | Chicago Title Of Mchigan Ion | |
| Brook Tammi L | $168,575 | Chicago Title Of Michigan In | |
| Pupel Diane M | $90,000 | None Available | |
| Oleniczak Donna M | -- | None Available | |
| Pupel Mcgee J | $94,900 | -- |
Source: Public Records
Mortgage History
| Date | Status | Borrower | Loan Amount |
|---|---|---|---|
| Previous Owner | Brook Tammi L | $160,146 | |
| Previous Owner | Pupel Diane M | $85,500 |
Source: Public Records
Tax History
| Year | Tax Paid | Tax Assessment Tax Assessment Total Assessment is a certain percentage of the fair market value that is determined by local assessors to be the total taxable value of land and additions on the property. | Land | Improvement |
|---|---|---|---|---|
| 2025 | $2,933 | $134,200 | $0 | $0 |
| 2024 | $29 | $124,200 | $0 | $0 |
| 2023 | $2,976 | $110,400 | $0 | $0 |
| 2022 | $2,825 | $99,200 | $0 | $0 |
| 2021 | $2,762 | $93,700 | $0 | $0 |
| 2020 | $2,641 | $88,800 | $0 | $0 |
| 2019 | $2,765 | $78,600 | $0 | $0 |
| 2018 | $2,676 | $76,900 | $0 | $0 |
| 2017 | $1,689 | $62,100 | $0 | $0 |
| 2016 | $1,709 | $56,700 | $0 | $0 |
| 2015 | $1,590 | $56,700 | $0 | $0 |
| 2013 | -- | $38,700 | $0 | $0 |
Source: Public Records
Map
Nearby Homes
- 2144 Ter van Dr NE
- 2151 Ter van Dr NE
- 2154 Ter van Dr NE Unit 49
- 2016 Tall Meadow St NE
- 2328 Dean Lake Ave NE
- 1847 Aberdeen St NE
- 2224 Tradition Dr NE Unit 32
- 1642 Timberlane Ln NE
- 1643 Aberdeen St NE
- 2420 Hylane Ct NE
- 2649 Dean Lake Ave NE
- 2324 Whimbrel Ct NE
- 2410 Shadowlane Dr NE
- 1818 Carlton Ave NE
- 2078 Celadon Dr NE
- 1161 Dorroll St NE
- 1313 Ellsmere St NE
- 1441 Beckwith Ave NE
- 2022 Celadon Dr NE Unit 106
- 1237 Dale Ct NE
- 2215 Mapleton St NE Unit B2
- 2215 Mapleton St NE Unit 132
- 2213 Mapleton St NE
- 2213 Mapleton St NE Unit 133
- 2217 Mapleton St NE
- 2217 Mapleton St NE Unit 131
- 2211 Mapleton St NE
- 2219 Mapleton St NE
- 2221 Mapleton St NE Unit 129
- 2208 Mapleton St NE
- 2208 Mapleton St NE Unit 135
- 2209 Mapleton St NE Unit 139
- 2206 Mapleton St NE
- 2207 Mapleton St NE
- 2207 Mapleton St NE Unit 140
- 2204 Mapleton St NE Unit 137
- 2225 Mapleton St NE
- 2202 Mapleton St NE
- 2218 Mapleton St NE
- 2218 Mapleton St NE Unit 126
Your Personal Tour Guide
Ask me questions while you tour the home.