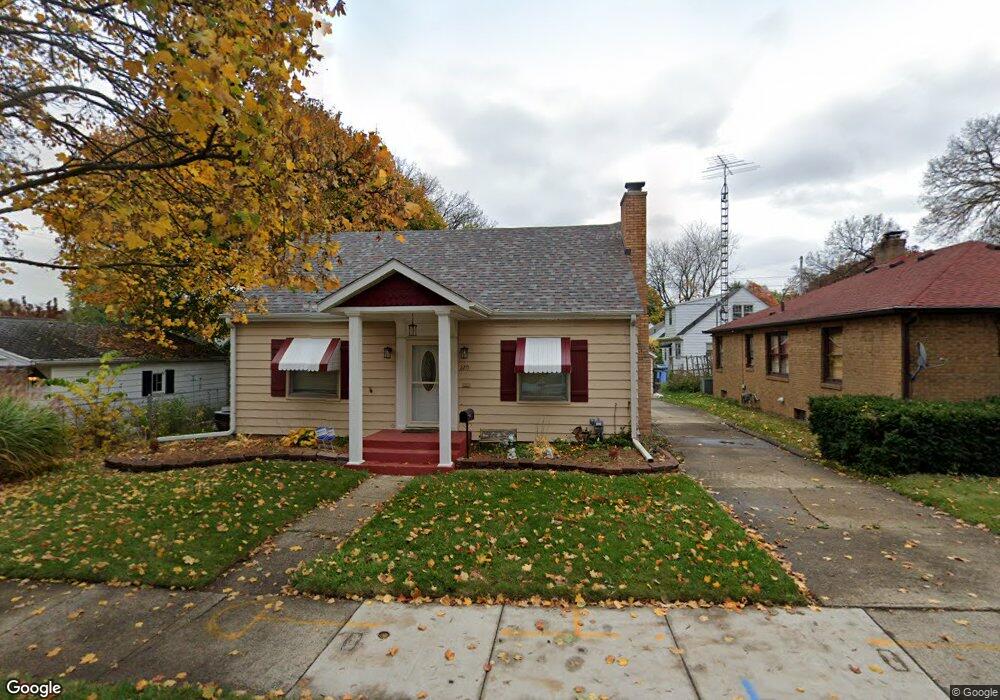
2215 Roberts Ln Lansing, MI 48910
Clifford Park NeighborhoodEstimated Value: $142,000 - $188,000
4
Beds
1
Bath
1,040
Sq Ft
$149/Sq Ft
Est. Value
About This Home
This home is located at 2215 Roberts Ln, Lansing, MI 48910 and is currently estimated at $154,519, approximately $148 per square foot. 2215 Roberts Ln is a home located in Ingham County with nearby schools including Lyons Elementary School, Attwood School, and Eastern High School.
Ownership History
Date
Name
Owned For
Owner Type
Purchase Details
Closed on
Aug 19, 2019
Sold by
Hernandez Mary S and Canady Hernandez Mary
Bought by
Hernandez Carlos and Canady Hernandez Mary
Current Estimated Value
Home Financials for this Owner
Home Financials are based on the most recent Mortgage that was taken out on this home.
Original Mortgage
$80,000
Outstanding Balance
$70,209
Interest Rate
3.8%
Mortgage Type
New Conventional
Estimated Equity
$84,310
Purchase Details
Closed on
Jul 31, 2012
Sold by
Independent Bank
Bought by
Hernandez Mary S
Home Financials for this Owner
Home Financials are based on the most recent Mortgage that was taken out on this home.
Original Mortgage
$44,184
Interest Rate
3.75%
Mortgage Type
FHA
Create a Home Valuation Report for This Property
The Home Valuation Report is an in-depth analysis detailing your home's value as well as a comparison with similar homes in the area
Home Values in the Area
Average Home Value in this Area
Purchase History
| Date | Buyer | Sale Price | Title Company |
|---|---|---|---|
| Hernandez Carlos | -- | None Available | |
| Hernandez Mary S | $45,000 | Independent Title Svcs Inc |
Source: Public Records
Mortgage History
| Date | Status | Borrower | Loan Amount |
|---|---|---|---|
| Open | Hernandez Carlos | $80,000 | |
| Closed | Hernandez Mary S | $44,184 |
Source: Public Records
Tax History
| Year | Tax Paid | Tax Assessment Tax Assessment Total Assessment is a certain percentage of the fair market value that is determined by local assessors to be the total taxable value of land and additions on the property. | Land | Improvement |
|---|---|---|---|---|
| 2025 | $3,074 | $59,000 | $7,300 | $51,700 |
| 2024 | $25 | $53,400 | $7,300 | $46,100 |
| 2023 | $2,893 | $48,800 | $7,300 | $41,500 |
| 2022 | $2,641 | $41,800 | $6,700 | $35,100 |
| 2021 | $2,015 | $38,800 | $4,400 | $34,400 |
| 2020 | $2,003 | $37,700 | $4,400 | $33,300 |
| 2019 | $1,919 | $32,800 | $4,400 | $28,400 |
| 2018 | $1,799 | $31,300 | $4,400 | $26,900 |
| 2017 | $1,722 | $31,300 | $4,400 | $26,900 |
| 2016 | $1,650 | $30,700 | $4,400 | $26,300 |
| 2015 | $1,650 | $29,300 | $8,809 | $20,491 |
| 2014 | $1,650 | $28,900 | $6,851 | $22,049 |
Source: Public Records
Map
Nearby Homes
- 2118 Roberts Ln
- 704 Mckim Ave
- 2340 S Pennsylvania Ave
- 2201 S Pennsylvania Ave
- 2309 S Pennsylvania Ave
- 1731 Lyons Ave
- 2215 Alpha St
- 616 Isbell St
- 315 E Mount Hope Ave
- 534 Isbell St
- 1731 Herbert St
- 1917 Teel Ave
- 2305 Forest Ave
- 1601 Bailey St
- 1535 Linval St
- 1807 Teel Ave
- 2418 Forest Ave
- 1515 Linval St
- 147 Isbell St
- 413 E Hodge Ave
Your Personal Tour Guide
Ask me questions while you tour the home.