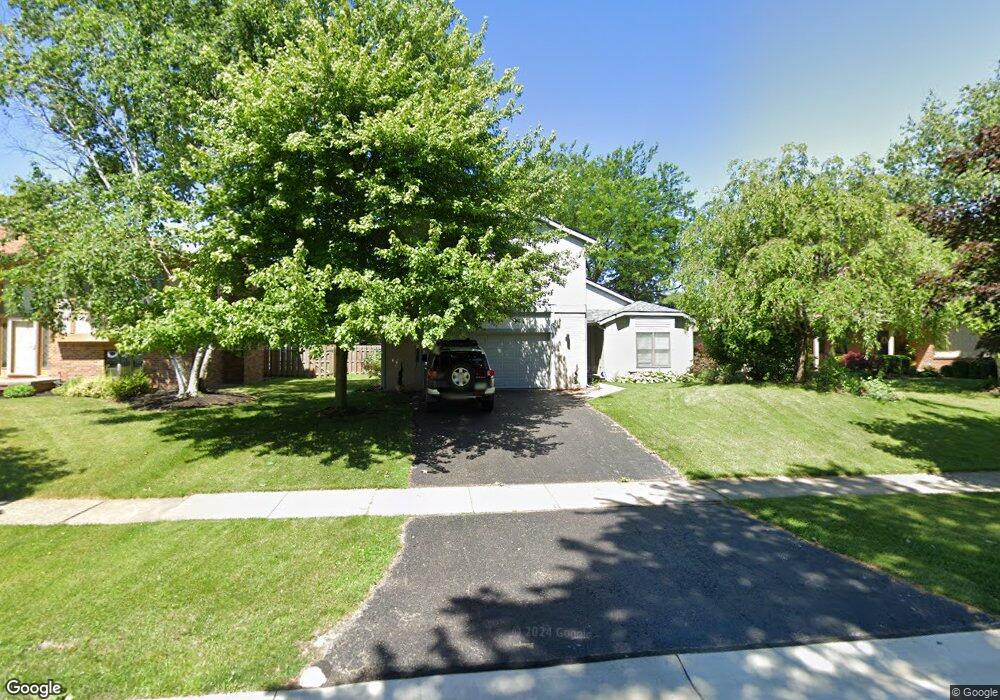
2215 Willowtree Ln Maumee, OH 43537
Estimated Value: $322,000 - $374,000
4
Beds
3
Baths
2,836
Sq Ft
$124/Sq Ft
Est. Value
About This Home
This home is located at 2215 Willowtree Ln, Maumee, OH 43537 and is currently estimated at $351,273, approximately $123 per square foot. 2215 Willowtree Ln is a home located in Lucas County with nearby schools including Fairfield Elementary School, Maumee Intermediate School, and Maumee Middle School.
Ownership History
Date
Name
Owned For
Owner Type
Purchase Details
Closed on
Mar 30, 2016
Sold by
Spaid Keith A
Bought by
Kreger Denny J
Current Estimated Value
Home Financials for this Owner
Home Financials are based on the most recent Mortgage that was taken out on this home.
Original Mortgage
$194,596
Outstanding Balance
$159,186
Interest Rate
4.62%
Mortgage Type
FHA
Estimated Equity
$192,087
Purchase Details
Closed on
Mar 21, 2005
Sold by
Fuller Timothy R and Fuller Jacqueline S
Bought by
Kreger Denny J and Spaid Keith A
Home Financials for this Owner
Home Financials are based on the most recent Mortgage that was taken out on this home.
Original Mortgage
$186,400
Interest Rate
5.64%
Mortgage Type
Purchase Money Mortgage
Purchase Details
Closed on
May 2, 1994
Sold by
Miltko Michael E and Miltko Amy J
Purchase Details
Closed on
Aug 30, 1990
Sold by
Jablonski Stephen M
Create a Home Valuation Report for This Property
The Home Valuation Report is an in-depth analysis detailing your home's value as well as a comparison with similar homes in the area
Home Values in the Area
Average Home Value in this Area
Purchase History
| Date | Buyer | Sale Price | Title Company |
|---|---|---|---|
| Kreger Denny J | -- | None Available | |
| Kreger Denny J | $233,000 | -- | |
| -- | $165,000 | -- | |
| -- | $150,000 | -- |
Source: Public Records
Mortgage History
| Date | Status | Borrower | Loan Amount |
|---|---|---|---|
| Open | Kreger Denny J | $194,596 | |
| Previous Owner | Kreger Denny J | $186,400 |
Source: Public Records
Tax History Compared to Growth
Tax History
| Year | Tax Paid | Tax Assessment Tax Assessment Total Assessment is a certain percentage of the fair market value that is determined by local assessors to be the total taxable value of land and additions on the property. | Land | Improvement |
|---|---|---|---|---|
| 2024 | $3,525 | $108,920 | $14,770 | $94,150 |
| 2023 | $6,940 | $91,595 | $12,985 | $78,610 |
| 2022 | $6,171 | $91,595 | $12,985 | $78,610 |
| 2021 | $6,515 | $91,595 | $12,985 | $78,610 |
| 2020 | $6,137 | $76,930 | $10,710 | $66,220 |
| 2019 | $5,984 | $76,930 | $10,710 | $66,220 |
| 2018 | $5,586 | $76,930 | $10,710 | $66,220 |
| 2017 | $5,295 | $67,445 | $10,780 | $56,665 |
| 2016 | $5,236 | $192,700 | $30,800 | $161,900 |
| 2015 | $5,211 | $192,700 | $30,800 | $161,900 |
| 2014 | $4,845 | $66,120 | $10,570 | $55,550 |
| 2013 | $4,845 | $66,120 | $10,570 | $55,550 |
Source: Public Records
Map
Nearby Homes
- 4501 Thackeray Rd
- 652 Mcintyre Ln
- 538 Cambridge Park S
- 541 Fairfield Park Dr
- 1441 Bradshaw Ct
- 611 Greenfield Dr
- 1409 Bradshaw Ct
- 422 Chesterfield Ln
- 54 Homestead Place Unit 54
- 4237 Brogan Dr
- 1466 Wilderness Dr
- 4534 Heathercove Place
- 2451 Eastgate Rd
- 1539 Cass Rd
- 1736 Parkway Dr N
- 2566 Green Valley Dr
- 1381 Junior Dr
- 1301 Cass Rd
- 1172 Shelly Ave
- 4796 Ryan Ridge Place
- 2211 Willowtree Ln
- 2219 Willowtree Ln
- 2212 Maple Tree Dr
- 2208 Maple Tree Dr
- 2216 Maple Tree Dr
- 2207 Willowtree Ln
- 2223 Willowtree Ln
- 2214 Willowtree Ln
- 2204 Maple Tree Dr
- 2220 Maple Tree Dr
- 2210 Willowtree Ln
- 2218 Willowtree Ln
- 2227 Willowtree Ln
- 547 Thackeray Rd
- 2206 Willowtree Ln
- 2222 Willowtree Ln
- 2224 Maple Tree Dr
- 2200 Maple Tree Dr
- 2202 Willowtree Ln
- 2226 Willowtree Ln