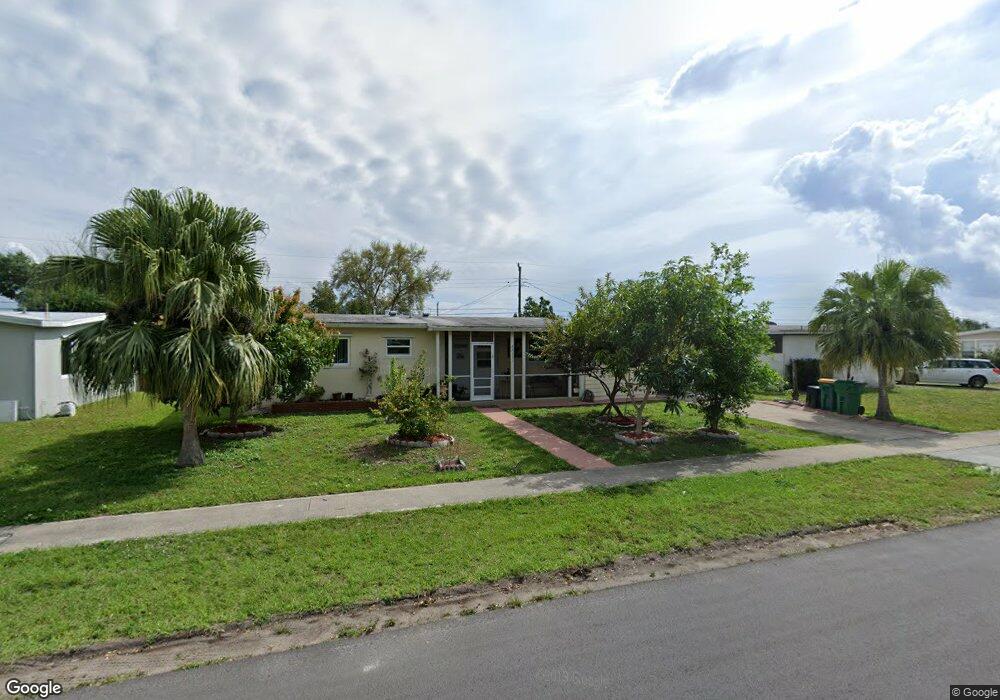
22151 Felton Ave Port Charlotte, FL 33952
Estimated Value: $158,000 - $184,000
2
Beds
1
Bath
1,490
Sq Ft
$112/Sq Ft
Est. Value
About This Home
This home is located at 22151 Felton Ave, Port Charlotte, FL 33952 and is currently estimated at $167,165, approximately $112 per square foot. 22151 Felton Ave is a home located in Charlotte County with nearby schools including Neil Armstrong Elementary School, Port Charlotte Middle School, and Charlotte High School.
Ownership History
Date
Name
Owned For
Owner Type
Purchase Details
Closed on
Nov 22, 2021
Sold by
Mary Ramirez Luz
Bought by
Garcia Jose Hernando and Garcia Ovelia
Current Estimated Value
Purchase Details
Closed on
Jul 1, 2016
Bought by
Ramirez Luz Mary and Magnolia Ga
Purchase Details
Closed on
Jan 22, 2004
Sold by
Dept Housing & Urban Dev Wa Dc
Bought by
Holecek Frank C
Purchase Details
Closed on
Nov 20, 2003
Sold by
Taylor Bean & Whitaker Mtg Corp
Bought by
Housing & Urban Dev
Purchase Details
Closed on
Aug 15, 2003
Sold by
Court Clerk Circuit
Bought by
Taylor Bean & Whitaker Mtg Corp
Purchase Details
Closed on
Aug 12, 2002
Sold by
Mcdevitt Caroline A
Bought by
Talmage Brian and Talmage Astra
Home Financials for this Owner
Home Financials are based on the most recent Mortgage that was taken out on this home.
Original Mortgage
$63,503
Interest Rate
6.52%
Mortgage Type
FHA
Purchase Details
Closed on
Nov 20, 2000
Sold by
Mcdevitt Francis A
Bought by
Mcdevit Caroline A
Create a Home Valuation Report for This Property
The Home Valuation Report is an in-depth analysis detailing your home's value as well as a comparison with similar homes in the area
Home Values in the Area
Average Home Value in this Area
Purchase History
| Date | Buyer | Sale Price | Title Company |
|---|---|---|---|
| Garcia Jose Hernando | $100 | None Listed On Document | |
| Ramirez Luz Mary | $78,000 | -- | |
| Holecek Frank C | $55,200 | -- | |
| Housing & Urban Dev | -- | -- | |
| Taylor Bean & Whitaker Mtg Corp | -- | -- | |
| Talmage Brian | $64,500 | -- | |
| Mcdevit Caroline A | -- | -- |
Source: Public Records
Mortgage History
| Date | Status | Borrower | Loan Amount |
|---|---|---|---|
| Previous Owner | Talmage Brian | $63,503 |
Source: Public Records
Tax History Compared to Growth
Tax History
| Year | Tax Paid | Tax Assessment Tax Assessment Total Assessment is a certain percentage of the fair market value that is determined by local assessors to be the total taxable value of land and additions on the property. | Land | Improvement |
|---|---|---|---|---|
| 2023 | $2,111 | $128,105 | $0 | $0 |
| 2022 | $2,020 | $124,374 | $13,600 | $110,774 |
| 2021 | $1,908 | $75,249 | $5,950 | $69,299 |
| 2020 | $1,803 | $70,311 | $4,505 | $65,806 |
| 2019 | $1,765 | $72,022 | $5,015 | $67,007 |
| 2018 | $1,567 | $67,332 | $4,505 | $62,827 |
| 2017 | $1,460 | $57,965 | $3,953 | $54,012 |
| 2016 | $1,140 | $38,009 | $0 | $0 |
| 2015 | $1,112 | $34,959 | $0 | $0 |
| 2014 | $1,030 | $31,781 | $0 | $0 |
Source: Public Records
Map
Nearby Homes
- 22247 Augusta Ave
- 22198 Felton Ave
- 2368 Starlite Ln
- 22342 Augusta Ave
- 22147 Catherine Ave
- 2309 Conway Blvd
- 22194 Catherine Ave
- 22011 Catherine Ave
- 22167 Marshall Ave
- 22201 Olean Blvd
- 22217 Olean Blvd
- 2142 Gerard Ct
- 21904 Beverly Ave
- 21962 Cellini Ave
- 2231 Claude Ct
- 2199 Hariet St
- 22348 Olean Blvd
- 22239 Midway Blvd
- 2254 Hayworth Rd
- 2208 Anne Ave
- 22159 Felton Ave
- 22143 Felton Ave
- 2425 Starlite Ln
- 2433 Starlite Ln
- 2417 Starlite Ln
- 22135 Felton Ave
- 22167 Felton Ave
- 22150 Felton Ave
- 22142 Felton Ave
- 2441 Starlite Ln
- 22158 Felton Ave
- 22134 Felton Ave
- 2409 Starlite Ln
- 22175 Felton Ave
- 22127 Felton Ave
- 2449 Starlite Ln
- 22166 Felton Ave
- 22126 Felton Ave
- 22169 Beverly Ave
- 22161 Beverly Ave