2216 29th St Lubbock, TX 79411
Heart of Lubbock NeighborhoodEstimated Value: $97,000 - $143,000
3
Beds
1
Bath
902
Sq Ft
$129/Sq Ft
Est. Value
About This Home
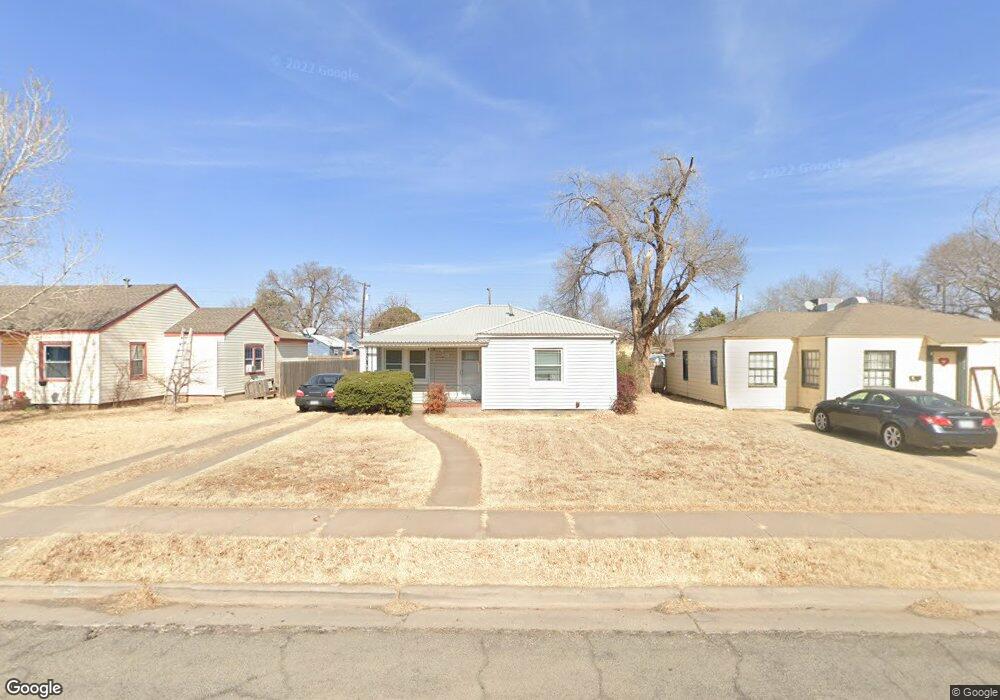
This home is located at 2216 29th St, Lubbock, TX 79411 and is currently estimated at $115,975, approximately $128 per square foot. 2216 29th St is a home located in Lubbock County with nearby schools including Dupre Elementary School, Slaton Middle School, and Monterey High School.
Ownership History
Date
Name
Owned For
Owner Type
Purchase Details
Closed on
Jul 20, 2015
Sold by
Hand Barbara
Bought by
Hall Johnny L
Current Estimated Value
Purchase Details
Closed on
Jun 10, 2015
Sold by
Rowell Carol
Bought by
Hall Johnny L
Purchase Details
Closed on
Jun 9, 2015
Sold by
Hall Bobbie
Bought by
Hall Johnny L
Purchase Details
Closed on
Jun 8, 2015
Sold by
Hall Neil
Bought by
Hall Johnny L
Purchase Details
Closed on
Jun 6, 2015
Sold by
Brewer Kathy Hall
Bought by
Hall Johnny L
Purchase Details
Closed on
Jun 5, 2015
Sold by
Hall Robert E
Bought by
Hall Johnny L
Create a Home Valuation Report for This Property
The Home Valuation Report is an in-depth analysis detailing your home's value as well as a comparison with similar homes in the area
Home Values in the Area
Average Home Value in this Area
Purchase History
| Date | Buyer | Sale Price | Title Company |
|---|---|---|---|
| Hall Johnny L | -- | None Available | |
| Hall Johnny L | -- | None Available | |
| Hall Johnny L | -- | None Available | |
| Hall Johnny L | -- | None Available | |
| Hall Johnny L | -- | None Available | |
| Hall Johnny L | -- | None Available |
Source: Public Records
Tax History Compared to Growth
Tax History
| Year | Tax Paid | Tax Assessment Tax Assessment Total Assessment is a certain percentage of the fair market value that is determined by local assessors to be the total taxable value of land and additions on the property. | Land | Improvement |
|---|---|---|---|---|
| 2025 | $1,699 | $97,378 | $32,000 | $65,378 |
| 2024 | $1,699 | $93,575 | $10,500 | $83,075 |
| 2023 | $1,758 | $94,558 | $10,500 | $84,058 |
| 2022 | $1,586 | $78,336 | $10,500 | $67,836 |
| 2021 | $1,536 | $71,723 | $10,500 | $61,223 |
| 2020 | $1,375 | $63,232 | $10,500 | $52,732 |
| 2019 | $1,279 | $56,975 | $10,500 | $46,475 |
| 2018 | $1,170 | $52,060 | $10,500 | $41,560 |
| 2017 | $1,140 | $50,669 | $3,300 | $47,369 |
| 2016 | $1,140 | $50,669 | $3,300 | $47,369 |
| 2015 | $1,045 | $50,566 | $3,300 | $47,266 |
| 2014 | $1,045 | $47,012 | $3,300 | $43,712 |
Source: Public Records
Map
Nearby Homes