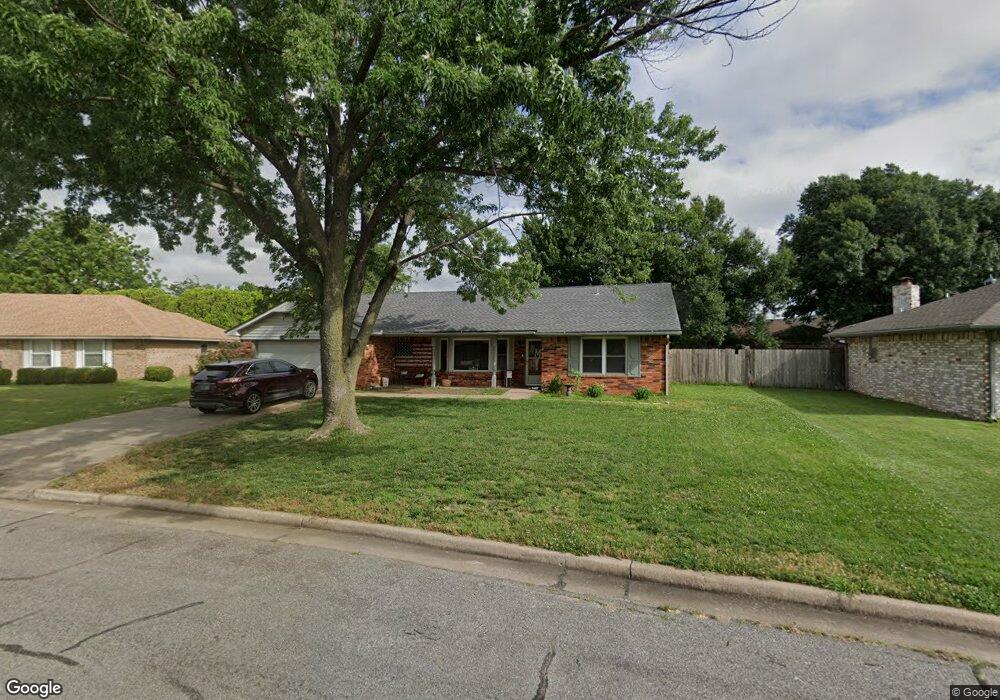
2216 Canary Dr Ponca City, OK 74601
Estimated Value: $202,925 - $219,000
3
Beds
2
Baths
1,856
Sq Ft
$114/Sq Ft
Est. Value
About This Home
This home is located at 2216 Canary Dr, Ponca City, OK 74601 and is currently estimated at $211,731, approximately $114 per square foot. 2216 Canary Dr is a home located in Kay County with nearby schools including Union Elementary School, Ponca City East Middle School, and Ponca City West Middle School.
Ownership History
Date
Name
Owned For
Owner Type
Purchase Details
Closed on
Jul 29, 2022
Sold by
Gribben Alexis D
Bought by
Montgomery Mikel Jarrod Jorda and Montgomery Mindy Beth
Current Estimated Value
Home Financials for this Owner
Home Financials are based on the most recent Mortgage that was taken out on this home.
Original Mortgage
$168,785
Outstanding Balance
$161,744
Interest Rate
5.81%
Mortgage Type
New Conventional
Estimated Equity
$49,987
Purchase Details
Closed on
Sep 1, 2015
Sold by
Cash Robert D and Cash Meehell C
Bought by
Gribben Alexis D
Home Financials for this Owner
Home Financials are based on the most recent Mortgage that was taken out on this home.
Original Mortgage
$126,663
Interest Rate
3.75%
Mortgage Type
FHA
Purchase Details
Closed on
Jul 27, 2000
Sold by
Mary Tim and Mary Gray
Bought by
Mechell Robert and Mechell Cash
Purchase Details
Closed on
Jul 28, 1992
Sold by
Pam Richard and Pam Burks
Bought by
Gray Timothy E and Gray Mary B
Create a Home Valuation Report for This Property
The Home Valuation Report is an in-depth analysis detailing your home's value as well as a comparison with similar homes in the area
Home Values in the Area
Average Home Value in this Area
Purchase History
| Date | Buyer | Sale Price | Title Company |
|---|---|---|---|
| Montgomery Mikel Jarrod Jorda | $171,900 | None Listed On Document | |
| Gribben Alexis D | $129,000 | Stewart Escrow & Title | |
| Mechell Robert | $85,000 | -- | |
| Gray Timothy E | $78,500 | -- |
Source: Public Records
Mortgage History
| Date | Status | Borrower | Loan Amount |
|---|---|---|---|
| Open | Montgomery Mikel Jarrod Jorda | $168,785 | |
| Previous Owner | Gribben Alexis D | $126,663 |
Source: Public Records
Tax History Compared to Growth
Tax History
| Year | Tax Paid | Tax Assessment Tax Assessment Total Assessment is a certain percentage of the fair market value that is determined by local assessors to be the total taxable value of land and additions on the property. | Land | Improvement |
|---|---|---|---|---|
| 2024 | $1,880 | $19,855 | $1,823 | $18,032 |
| 2023 | $1,880 | $18,909 | $1,790 | $17,119 |
| 2022 | $1,247 | $14,103 | $1,912 | $12,191 |
| 2021 | $1,253 | $14,103 | $1,912 | $12,191 |
| 2020 | $1,228 | $13,976 | $1,912 | $12,064 |
| 2019 | $1,201 | $13,569 | $1,912 | $11,657 |
| 2018 | $1,234 | $13,740 | $1,912 | $11,828 |
| 2017 | $1,284 | $14,104 | $1,912 | $12,192 |
| 2016 | $1,306 | $14,190 | $1,707 | $12,483 |
| 2015 | $869 | $9,741 | $1,093 | $8,648 |
| 2014 | $845 | $9,661 | $1,035 | $8,626 |
Source: Public Records
Map
Nearby Homes
- 0000 N Union St
- 2005 N 4th St
- 2000 N 5th St
- 113 E Fresno Ave
- 1708 Potomac Dr
- 120 E Woodbury Rd
- 304 E Detroit Ave
- TBD 5th and Windsor
- 1217 N Pine St
- 1412 Donahoe Dr
- 1016 N Oak St
- 1008 N 1st St
- 1021 Riviera Dr
- 1013 N 7th St
- 941 N Ash St
- 3651 N 14th St
- 920 N 4th St
- 734 E Albany Ave
- 1128 N 14th St
- 121 Hillside Ave