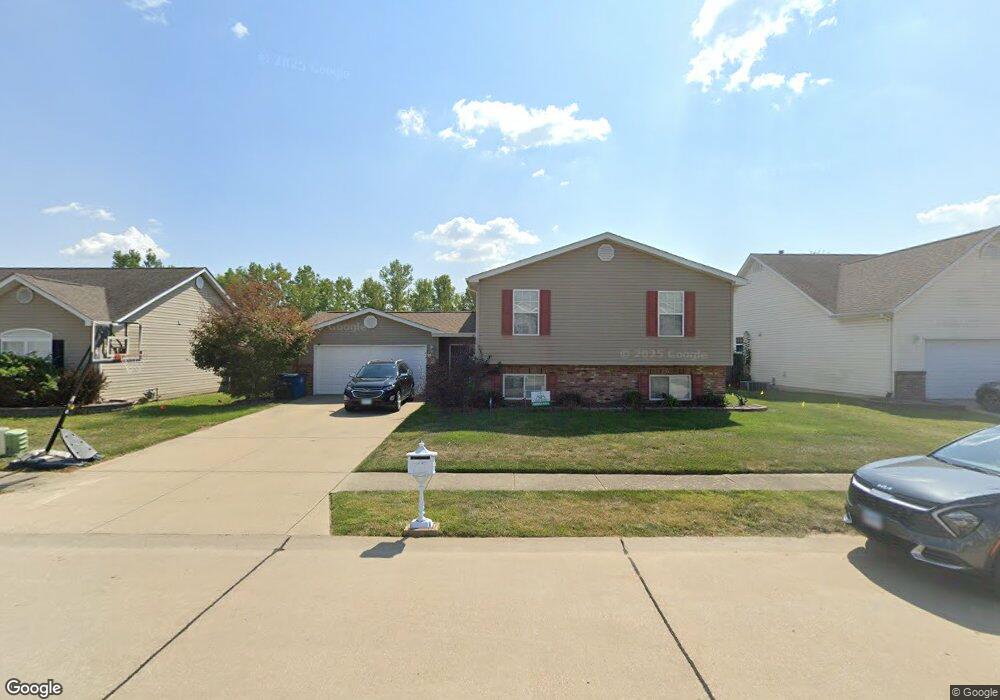
2216 Hunters Point Dr Granite City, IL 62040
Estimated Value: $166,000 - $273,000
3
Beds
2
Baths
1,232
Sq Ft
$188/Sq Ft
Est. Value
About This Home
This home is located at 2216 Hunters Point Dr, Granite City, IL 62040 and is currently estimated at $231,393, approximately $187 per square foot. 2216 Hunters Point Dr is a home located in Madison County with nearby schools including Granite City High School, Rivers of Life Christian School, and Metro East Montessori School.
Ownership History
Date
Name
Owned For
Owner Type
Purchase Details
Closed on
Aug 19, 2013
Sold by
Cagle Jeremiah D and Ostermeier Christina M
Bought by
Matkins Karen and Matkins Edgar S
Current Estimated Value
Home Financials for this Owner
Home Financials are based on the most recent Mortgage that was taken out on this home.
Original Mortgage
$140,409
Outstanding Balance
$103,831
Interest Rate
4.25%
Mortgage Type
FHA
Estimated Equity
$127,562
Purchase Details
Closed on
Apr 29, 2008
Sold by
Hunters Point Homes Llc
Bought by
Cagle Jeremiah D and Ostermeier Christina M
Home Financials for this Owner
Home Financials are based on the most recent Mortgage that was taken out on this home.
Original Mortgage
$151,522
Interest Rate
5.88%
Mortgage Type
FHA
Create a Home Valuation Report for This Property
The Home Valuation Report is an in-depth analysis detailing your home's value as well as a comparison with similar homes in the area
Home Values in the Area
Average Home Value in this Area
Purchase History
| Date | Buyer | Sale Price | Title Company |
|---|---|---|---|
| Matkins Karen | $143,000 | Metro Title & Escrow Co | |
| Cagle Jeremiah D | $154,000 | First American Title Ins Co |
Source: Public Records
Mortgage History
| Date | Status | Borrower | Loan Amount |
|---|---|---|---|
| Open | Matkins Karen | $140,409 | |
| Previous Owner | Cagle Jeremiah D | $151,522 |
Source: Public Records
Tax History Compared to Growth
Tax History
| Year | Tax Paid | Tax Assessment Tax Assessment Total Assessment is a certain percentage of the fair market value that is determined by local assessors to be the total taxable value of land and additions on the property. | Land | Improvement |
|---|---|---|---|---|
| 2024 | $4,127 | $58,350 | $5,400 | $52,950 |
| 2023 | $4,127 | $52,590 | $4,870 | $47,720 |
| 2022 | $3,960 | $48,180 | $4,460 | $43,720 |
| 2021 | $3,535 | $45,180 | $4,180 | $41,000 |
| 2020 | $3,930 | $43,150 | $3,990 | $39,160 |
| 2019 | $3,782 | $40,900 | $3,780 | $37,120 |
| 2018 | $3,673 | $39,710 | $3,670 | $36,040 |
| 2017 | $3,603 | $41,180 | $3,810 | $37,370 |
| 2016 | $3,697 | $41,180 | $3,810 | $37,370 |
| 2015 | $3,334 | $41,180 | $3,810 | $37,370 |
| 2014 | $3,334 | $41,180 | $3,810 | $37,370 |
| 2013 | $3,334 | $41,180 | $3,810 | $37,370 |
Source: Public Records
Map
Nearby Homes
- 2209 Elm Ave
- 2333 Cardinal Ave
- 2800 Birch Ave
- 2829 Edgewood Ave
- 2822 Sunset Dr
- 2817 Maryville Rd
- 2912 Ash Ave
- 3009 Willow Ave
- 2914 Pershing Blvd
- 2913 Dogwood Dr
- 3040 Dale Ave
- 2701 Marshall Ave
- 2465 St Clair
- 2922 Marshall Ave
- 3017 Wayne Ave
- 2814 Palmer Ave
- 2821 Edwards St
- 3028 Wayne Ave
- 2664 E 28th St
- 52 Villa Dr
- 2232 Hunters Point Dr
- 2206 Hunters Point Dr
- 2212 Hunters Point Dr
- 2220 Hunters Point Dr
- 2224 Hunters Point Dr
- 2640 Deerfield Dr
- 2217 Hunters Point Dr
- 2213 Hunters Point Dr
- 2221 Hunters Point Dr
- 2225 Hunters Point Dr
- 2209 Hunters Point Dr
- 2247 Wildwood Dr
- 2205 Hunters Point Dr
- 2229 Hunters Point Dr
- 2201 Hunters Point Dr
- 2233 Hunters Point Dr
- 2641 Deerfield Dr
- 2440 Willow Ave
- 2165 Hunters Point Dr
- 2237 Hunters Point Dr