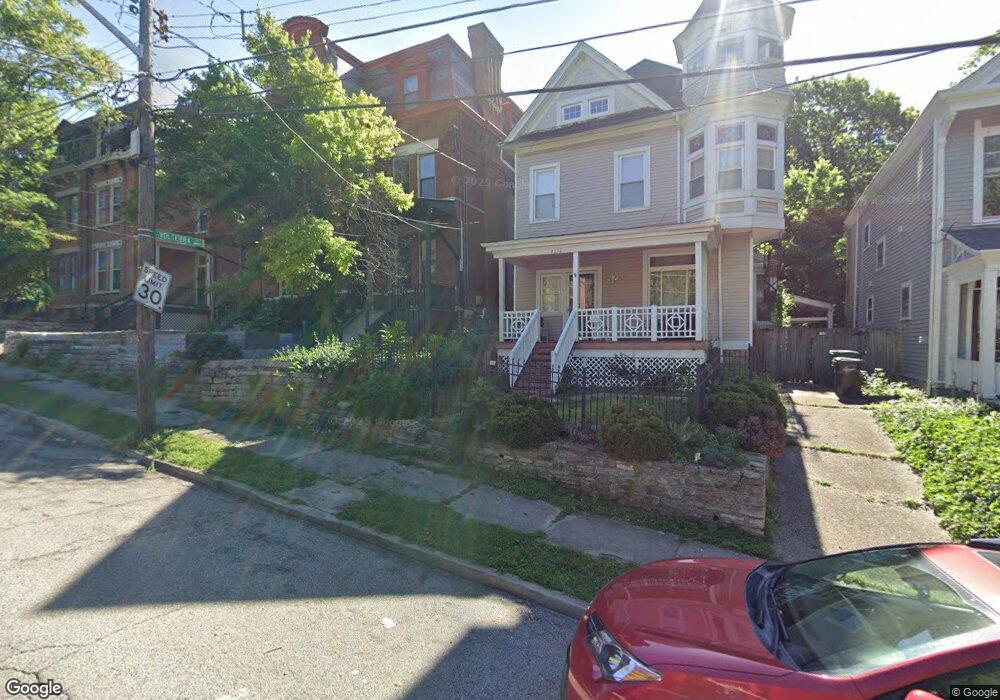
2216 Kemper Ln Cincinnati, OH 45206
Walnut Hills NeighborhoodEstimated Value: $363,000 - $529,000
3
Beds
3
Baths
1,747
Sq Ft
$249/Sq Ft
Est. Value
About This Home
This home is located at 2216 Kemper Ln, Cincinnati, OH 45206 and is currently estimated at $434,303, approximately $248 per square foot. 2216 Kemper Ln is a home located in Hamilton County with nearby schools including Frederick Douglass Elementary School, Robert A. Taft Information Technology High School, and Clark Montessori High School.
Ownership History
Date
Name
Owned For
Owner Type
Purchase Details
Closed on
Dec 14, 2001
Sold by
Crabtree Tamara P
Bought by
Brisley Pamela S
Current Estimated Value
Home Financials for this Owner
Home Financials are based on the most recent Mortgage that was taken out on this home.
Original Mortgage
$140,000
Outstanding Balance
$53,771
Interest Rate
6.34%
Estimated Equity
$380,532
Purchase Details
Closed on
Dec 17, 1998
Sold by
Huller Mary E
Bought by
Crabtree Tamara P
Home Financials for this Owner
Home Financials are based on the most recent Mortgage that was taken out on this home.
Original Mortgage
$140,350
Interest Rate
6.96%
Mortgage Type
Balloon
Purchase Details
Closed on
Jul 30, 1994
Sold by
Parson James W and Parsons James W
Bought by
Huller Mary E
Home Financials for this Owner
Home Financials are based on the most recent Mortgage that was taken out on this home.
Original Mortgage
$96,340
Interest Rate
8.53%
Create a Home Valuation Report for This Property
The Home Valuation Report is an in-depth analysis detailing your home's value as well as a comparison with similar homes in the area
Home Values in the Area
Average Home Value in this Area
Purchase History
| Date | Buyer | Sale Price | Title Company |
|---|---|---|---|
| Brisley Pamela S | $183,700 | -- | |
| Crabtree Tamara P | $168,400 | -- | |
| Huller Mary E | -- | -- |
Source: Public Records
Mortgage History
| Date | Status | Borrower | Loan Amount |
|---|---|---|---|
| Open | Brisley Pamela S | $140,000 | |
| Previous Owner | Crabtree Tamara P | $140,350 | |
| Previous Owner | Huller Mary E | $96,340 |
Source: Public Records
Tax History Compared to Growth
Tax History
| Year | Tax Paid | Tax Assessment Tax Assessment Total Assessment is a certain percentage of the fair market value that is determined by local assessors to be the total taxable value of land and additions on the property. | Land | Improvement |
|---|---|---|---|---|
| 2024 | $5,576 | $93,373 | $20,328 | $73,045 |
| 2023 | $5,702 | $93,373 | $20,328 | $73,045 |
| 2022 | $4,996 | $73,371 | $15,974 | $57,397 |
| 2021 | $4,808 | $73,371 | $15,974 | $57,397 |
| 2020 | $4,949 | $73,371 | $15,974 | $57,397 |
| 2019 | $4,917 | $66,700 | $14,522 | $52,178 |
| 2018 | $4,925 | $66,700 | $14,522 | $52,178 |
| 2017 | $4,679 | $66,700 | $14,522 | $52,178 |
| 2016 | $4,035 | $56,707 | $14,231 | $42,476 |
| 2015 | $3,638 | $56,707 | $14,231 | $42,476 |
| 2014 | $3,664 | $56,707 | $14,231 | $42,476 |
| 2013 | $3,803 | $57,866 | $14,522 | $43,344 |
Source: Public Records
Map
Nearby Homes
- 2106 Kemper Ln
- 2191 Victory Pkwy
- 2195 Victory Pkwy
- 2199 Victory Pkwy
- 967 Windsor St
- 2019 Calvin Cliff St Unit 10
- 965 Windsor St
- 2210 Victory Pkwy
- 2334 Kemper Ln
- 2232 Fulton Ave
- 2110 Fulton Ave
- 2114 Fulton Ave
- 2100 Fulton Ave
- 2324 Park Ave
- 911 Rogers Place
- 2356 Park Ave
- 2356 Park Ave Unit 44
- 2100 Sinton Ave
- 2218 Kemper Ln
- 2212 Kemper Ln
- 2220 Kemper Ln
- 2222 Kemper Ln
- 2224 Kemper Ln
- 2226 Kemper Ln
- 2200 Kemper Ln
- 2202 Kemper Ln
- 2120 Kemper Ln
- 2120 Kemper Ln Unit 1 & 2
- 2120 Kemper Ln Unit 2
- 2122 Kemper Ln
- 2122 Kemper Ln
- 2122 Kemper Ln
- 2122 Kemper Ln Unit 5
- 2223 Kemper Ln Unit 1
- 2219 Park Ave
- 2221 Park Ave
- 2217 Park Ave
- 2232 Kemper Ln