Estimated Value: $354,415 - $391,000
3
Beds
2
Baths
1,733
Sq Ft
$213/Sq Ft
Est. Value
About This Home
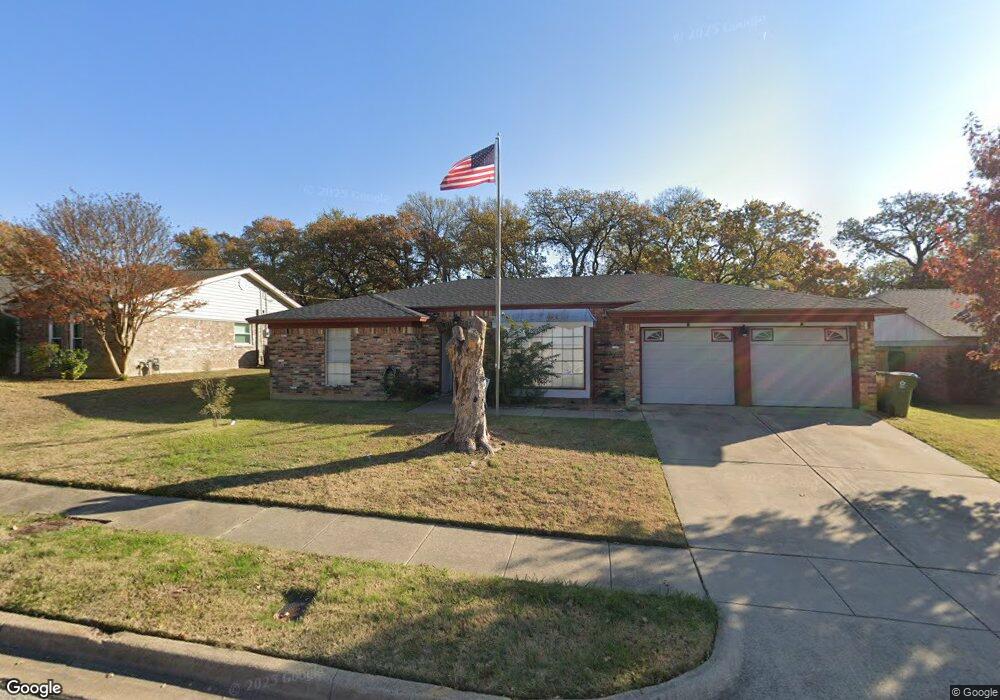
This home is located at 2216 Mountainview Dr, Hurst, TX 76054 and is currently estimated at $368,604, approximately $212 per square foot. 2216 Mountainview Dr is a home located in Tarrant County with nearby schools including Walker Creek Elementary School, Smithfield Middle School, and Birdville High School.
Ownership History
Date
Name
Owned For
Owner Type
Purchase Details
Closed on
Jun 3, 2014
Sold by
Pierce Catherine
Bought by
Pierce Brian and Pierce Catherine
Current Estimated Value
Purchase Details
Closed on
Mar 25, 2014
Sold by
Pierce Bruce C
Bought by
Pierce Catherine K
Purchase Details
Closed on
Mar 25, 1994
Sold by
Cisneros Henry G
Bought by
Pierce Bruce C and Pierce Catherine K
Home Financials for this Owner
Home Financials are based on the most recent Mortgage that was taken out on this home.
Original Mortgage
$76,426
Interest Rate
7.21%
Mortgage Type
FHA
Purchase Details
Closed on
Nov 7, 1993
Sold by
Sunbelt National Mtg Corp
Bought by
Hud
Purchase Details
Closed on
Oct 5, 1993
Sold by
Patton Lisle D
Bought by
Sunbelt National Mtg Corp
Create a Home Valuation Report for This Property
The Home Valuation Report is an in-depth analysis detailing your home's value as well as a comparison with similar homes in the area
Home Values in the Area
Average Home Value in this Area
Purchase History
| Date | Buyer | Sale Price | Title Company |
|---|---|---|---|
| Pierce Brian | -- | None Available | |
| Pierce Catherine K | -- | None Available | |
| Pierce Bruce C | -- | -- | |
| Hud | -- | -- | |
| Sunbelt National Mtg Corp | -- | -- |
Source: Public Records
Mortgage History
| Date | Status | Borrower | Loan Amount |
|---|---|---|---|
| Closed | Pierce Bruce C | $76,426 |
Source: Public Records
Tax History
| Year | Tax Paid | Tax Assessment Tax Assessment Total Assessment is a certain percentage of the fair market value that is determined by local assessors to be the total taxable value of land and additions on the property. | Land | Improvement |
|---|---|---|---|---|
| 2025 | $978 | $288,975 | $75,000 | $213,975 |
| 2024 | $978 | $288,975 | $75,000 | $213,975 |
| 2023 | $6,288 | $285,780 | $55,000 | $230,780 |
| 2022 | $6,184 | $250,137 | $55,000 | $195,137 |
| 2021 | $5,960 | $229,737 | $55,000 | $174,737 |
| 2020 | $5,753 | $249,317 | $55,000 | $194,317 |
| 2019 | $5,349 | $258,876 | $55,000 | $203,876 |
| 2018 | $2,182 | $185,009 | $55,000 | $130,009 |
| 2017 | $4,488 | $196,184 | $18,000 | $178,184 |
| 2016 | $4,080 | $185,044 | $18,000 | $167,044 |
| 2015 | $2,214 | $139,000 | $17,000 | $122,000 |
| 2014 | $2,214 | $139,000 | $17,000 | $122,000 |
Source: Public Records
Map
Nearby Homes
- 2204 Mountainview Dr
- 2201 Mountainview Dr
- 2244 Hurstview Dr
- 2221 Farrington Ln
- 317 Northglen Dr
- 2157 Lookout Ct
- 617 Indian Trail
- 421 Cavender Ct
- 404 Mountainview Dr
- 2620 Brookridge Dr
- 200 Eagle Ct
- 1905 Cimarron Trail
- 305 Warbler Dr
- 3716 Sweetbriar Ln
- 440 W Louella Dr
- 3006 Carolyn Ct
- 3002 Carolyn Ct
- 417 Sunnybrook Ct
- 104 Greenbriar Ln
- 413 Blue Jay Ct
- 2220 Mountainview Dr
- 2212 Mountainview Dr
- 2217 Cambridge Dr
- 2213 Cambridge Dr
- 2221 Cambridge Dr
- 2208 Mountainview Dr
- 2224 Mountainview Dr
- 2217 Mountainview Dr
- 2209 Cambridge Dr
- 2213 Mountainview Dr
- 2221 Mountainview Dr
- 2225 Cambridge Dr
- 2225 Mountainview Dr
- 2228 Mountainview Dr
- 2209 Mountainview Dr
- 2229 Cambridge Dr
- 2229 Mountainview Dr
- 2205 Mountainview Dr
- 2216 Cambridge Dr
- 2212 Cambridge Dr
Your Personal Tour Guide
Ask me questions while you tour the home.