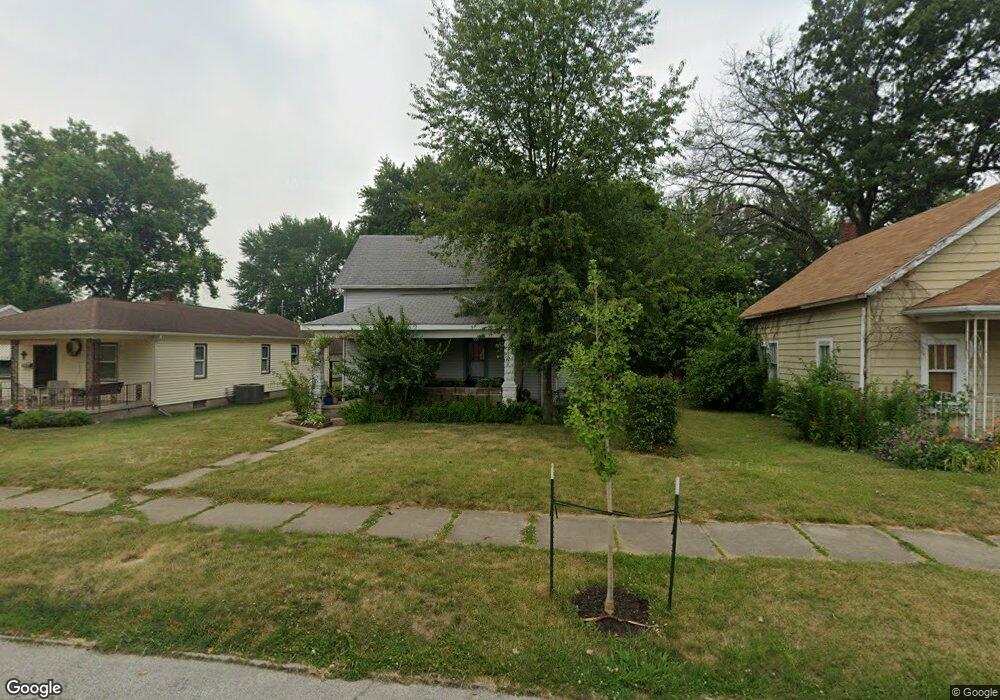
2216 N 20th St Lafayette, IN 47904
Saint Lawrence McAllister NeighborhoodEstimated Value: $171,000 - $183,000
--
Bed
--
Bath
1,068
Sq Ft
$165/Sq Ft
Est. Value
About This Home
This home is located at 2216 N 20th St, Lafayette, IN 47904 and is currently estimated at $176,417, approximately $165 per square foot. 2216 N 20th St is a home located in Tippecanoe County with nearby schools including Vinton Elementary School, Sunnyside Intermediate School, and Lafayette Tecumseh Junior High School.
Ownership History
Date
Name
Owned For
Owner Type
Purchase Details
Closed on
Jul 11, 2014
Sold by
Garsia Tammy S
Bought by
Garsia Miguel
Current Estimated Value
Purchase Details
Closed on
Mar 23, 2001
Sold by
Gaeta Abel and Gaeta Donna J
Bought by
Garsia Miguel and Garsia Tammy S
Home Financials for this Owner
Home Financials are based on the most recent Mortgage that was taken out on this home.
Original Mortgage
$35,000
Interest Rate
7.13%
Mortgage Type
Purchase Money Mortgage
Create a Home Valuation Report for This Property
The Home Valuation Report is an in-depth analysis detailing your home's value as well as a comparison with similar homes in the area
Home Values in the Area
Average Home Value in this Area
Purchase History
| Date | Buyer | Sale Price | Title Company |
|---|---|---|---|
| Garsia Miguel | -- | -- | |
| Garsia Miguel | -- | -- |
Source: Public Records
Mortgage History
| Date | Status | Borrower | Loan Amount |
|---|---|---|---|
| Closed | Garsia Miguel | $35,000 |
Source: Public Records
Tax History Compared to Growth
Tax History
| Year | Tax Paid | Tax Assessment Tax Assessment Total Assessment is a certain percentage of the fair market value that is determined by local assessors to be the total taxable value of land and additions on the property. | Land | Improvement |
|---|---|---|---|---|
| 2024 | $996 | $125,300 | $16,300 | $109,000 |
| 2023 | $877 | $115,200 | $16,300 | $98,900 |
| 2022 | $724 | $96,900 | $16,300 | $80,600 |
| 2021 | $541 | $83,700 | $16,300 | $67,400 |
| 2020 | $441 | $78,100 | $16,300 | $61,800 |
| 2019 | $372 | $70,300 | $11,000 | $59,300 |
| 2018 | $359 | $67,300 | $11,000 | $56,300 |
| 2017 | $347 | $66,200 | $11,000 | $55,200 |
| 2016 | $324 | $63,700 | $11,000 | $52,700 |
| 2014 | $353 | $70,100 | $11,000 | $59,100 |
| 2013 | $1,393 | $69,400 | $11,000 | $58,400 |
Source: Public Records
Map
Nearby Homes
- 2215 N 18th St
- 2022 Elk St
- 2340 N 20th St
- 2100 N 18th St
- 2001 Schuyler Ave
- 2226 N 23rd St
- 2101 Monon Ave
- 2107 Monon Ave
- 108 Barbee St
- 2211 N 24th St
- 2127 Perrine St
- 2209 Monon Ave
- 1729 Arlington Rd
- 1925 Maple St
- 1831 N 13th St
- 1908 Whitcomb Ave
- 1904 Greenbush St
- 2007 N 27th St
- 2716 Longlois Dr
- 1430 N 16th St