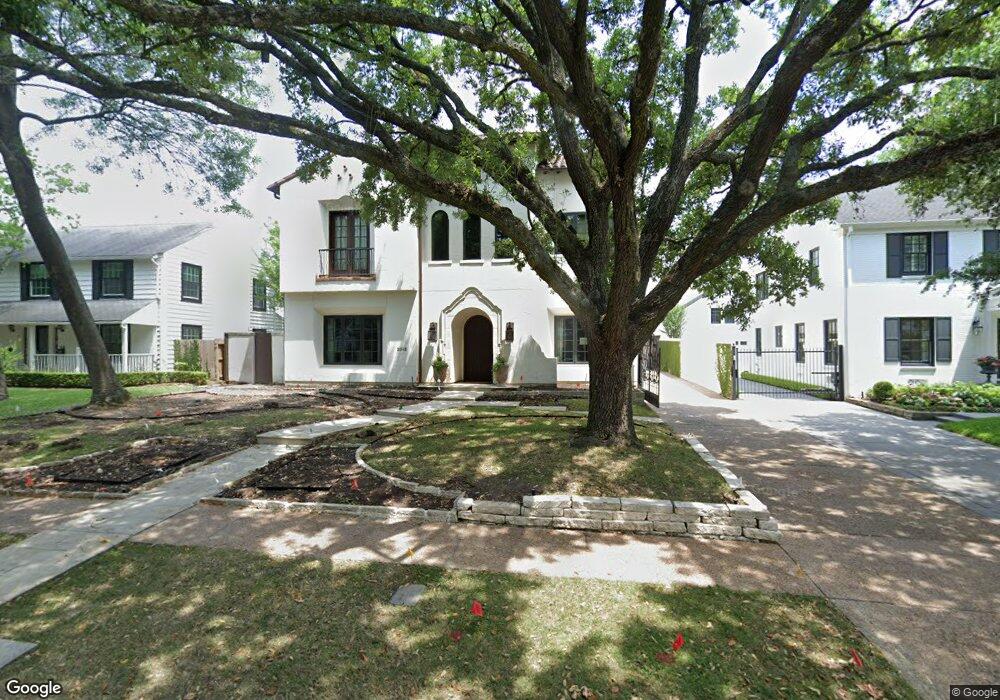
2216 Pelham Dr Houston, TX 77019
River Oaks NeighborhoodEstimated Value: $3,193,000 - $3,564,468
4
Beds
6
Baths
6,248
Sq Ft
$548/Sq Ft
Est. Value
About This Home
This home is located at 2216 Pelham Dr, Houston, TX 77019 and is currently estimated at $3,424,823, approximately $548 per square foot. 2216 Pelham Dr is a home located in Harris County with nearby schools including River Oaks Elementary School, Lanier Middle School, and Lamar High School.
Ownership History
Date
Name
Owned For
Owner Type
Purchase Details
Closed on
Jun 25, 2008
Sold by
Revital Property Investments Llc
Bought by
Andrews Benjamin B and Smith Christine A
Current Estimated Value
Home Financials for this Owner
Home Financials are based on the most recent Mortgage that was taken out on this home.
Original Mortgage
$1,760,000
Outstanding Balance
$1,129,385
Interest Rate
6.05%
Mortgage Type
Purchase Money Mortgage
Estimated Equity
$2,295,438
Purchase Details
Closed on
Mar 28, 2008
Sold by
Prosperity Bank
Bought by
Revital Property Investments Llc
Home Financials for this Owner
Home Financials are based on the most recent Mortgage that was taken out on this home.
Original Mortgage
$1,760,000
Interest Rate
7%
Mortgage Type
Purchase Money Mortgage
Purchase Details
Closed on
Feb 5, 2008
Sold by
Millennium Companies Ltd
Bought by
Prosperity Bank
Home Financials for this Owner
Home Financials are based on the most recent Mortgage that was taken out on this home.
Original Mortgage
$1,760,000
Interest Rate
7%
Mortgage Type
Purchase Money Mortgage
Purchase Details
Closed on
Jan 13, 2006
Sold by
Winfrey Bruce
Bought by
Millennium Companies Ltd
Home Financials for this Owner
Home Financials are based on the most recent Mortgage that was taken out on this home.
Original Mortgage
$1,694,383
Interest Rate
6.25%
Mortgage Type
Purchase Money Mortgage
Purchase Details
Closed on
Jul 8, 2005
Sold by
Maniscalco Giuseppe and Cipkus Berenika
Bought by
Winfrey Bruce
Home Financials for this Owner
Home Financials are based on the most recent Mortgage that was taken out on this home.
Original Mortgage
$554,000
Interest Rate
6.74%
Mortgage Type
Fannie Mae Freddie Mac
Purchase Details
Closed on
Mar 25, 1997
Sold by
Talty Maris A
Bought by
Maniscalco Giuseppe
Home Financials for this Owner
Home Financials are based on the most recent Mortgage that was taken out on this home.
Original Mortgage
$180,000
Interest Rate
7.65%
Purchase Details
Closed on
Jul 24, 1996
Sold by
Bowen Samuel F and Edens Robert B
Bought by
Cavallo Giuseppina
Home Financials for this Owner
Home Financials are based on the most recent Mortgage that was taken out on this home.
Original Mortgage
$29,750
Interest Rate
8.32%
Mortgage Type
Seller Take Back
Purchase Details
Closed on
Jun 24, 1994
Sold by
Ching Lee and Ching Mee Gam
Bought by
Talty Marisa
Purchase Details
Closed on
Dec 7, 1993
Sold by
Talty Michael K
Bought by
Talty Marisa
Create a Home Valuation Report for This Property
The Home Valuation Report is an in-depth analysis detailing your home's value as well as a comparison with similar homes in the area
Home Values in the Area
Average Home Value in this Area
Purchase History
| Date | Buyer | Sale Price | Title Company |
|---|---|---|---|
| Andrews Benjamin B | -- | Chicago Title Insurance Co | |
| Revital Property Investments Llc | -- | Etc | |
| Prosperity Bank | $1,600,000 | None Available | |
| Millennium Companies Ltd | -- | Chicago Title Insurance Co | |
| Winfrey Bruce | -- | Houston Title Co | |
| Maniscalco Giuseppe | -- | Title Agency #26 | |
| Cavallo Giuseppina | -- | American Title Co | |
| Talty Marisa | -- | First American Title | |
| Talty Marisa | -- | -- |
Source: Public Records
Mortgage History
| Date | Status | Borrower | Loan Amount |
|---|---|---|---|
| Open | Andrews Benjamin B | $1,760,000 | |
| Previous Owner | Revital Property Investments Llc | $1,760,000 | |
| Previous Owner | Millennium Companies Ltd | $1,694,383 | |
| Previous Owner | Winfrey Bruce | $554,000 | |
| Previous Owner | Maniscalco Giuseppe | $180,000 | |
| Previous Owner | Cavallo Giuseppina | $29,750 | |
| Closed | Winfrey Bruce | $138,500 |
Source: Public Records
Tax History Compared to Growth
Tax History
| Year | Tax Paid | Tax Assessment Tax Assessment Total Assessment is a certain percentage of the fair market value that is determined by local assessors to be the total taxable value of land and additions on the property. | Land | Improvement |
|---|---|---|---|---|
| 2025 | $41,958 | $3,833,422 | $1,335,345 | $2,498,077 |
| 2024 | $41,958 | $2,766,253 | $1,254,415 | $1,511,838 |
| 2023 | $41,958 | $2,800,000 | $1,213,950 | $1,586,050 |
| 2022 | $57,521 | $2,612,370 | $1,173,485 | $1,438,885 |
| 2021 | $62,819 | $2,695,314 | $1,092,555 | $1,602,759 |
| 2020 | $65,269 | $2,695,314 | $1,092,555 | $1,602,759 |
| 2019 | $75,913 | $3,200,100 | $1,092,555 | $2,107,545 |
| 2018 | $57,869 | $2,970,436 | $1,052,090 | $1,918,346 |
| 2017 | $75,109 | $2,970,436 | $1,052,090 | $1,918,346 |
| 2016 | $70,028 | $3,066,656 | $1,126,510 | $1,940,146 |
| 2015 | $47,135 | $3,000,000 | $1,086,278 | $1,913,722 |
| 2014 | $47,135 | $2,400,000 | $925,348 | $1,474,652 |
Source: Public Records
Map
Nearby Homes
- 2233 Pelham Dr
- 2217 Pelham Dr
- 2249 Pelham Dr
- 2204 Inwood Dr
- 2413 Brentwood Dr
- 1915 Spann St
- 2323 San Felipe St Unit 901
- 2323 San Felipe St Unit 1101
- 2323 San Felipe St Unit 602
- 2131 Brentwood Dr
- 2105 Del Monte Dr
- 2525 Inwood Dr
- 2221 Welch St Unit 201
- 2221 Welch St Unit 401
- 1913 Revere St
- 2240 Mimosa Dr Unit 4W
- 2240 Mimosa Dr Unit 4N
- 2240 Mimosa Dr Unit PH-8W
- 2240 Mimosa Dr Unit 6W
- 2240 Mimosa Dr Unit 5W
- 2210 Pelham Dr
- 2204 Pelham Dr
- 2226 Pelham Dr
- 2219 Del Monte Dr
- 2213 Del Monte Dr
- 2223 Del Monte Dr
- 2207 Del Monte Dr
- 2232 Pelham Dr
- 2211 Pelham Dr
- 2158 Pelham Dr
- 2221 Pelham Dr
- 2229 Del Monte Dr
- 2205 Pelham Dr
- 2227 Pelham Dr
- 2159 Del Monte Dr
- 2235 Del Monte Dr
- 2236 Pelham Dr
- 2152 Pelham Dr
- 2159 Pelham Dr
- 2153 Del Monte Dr