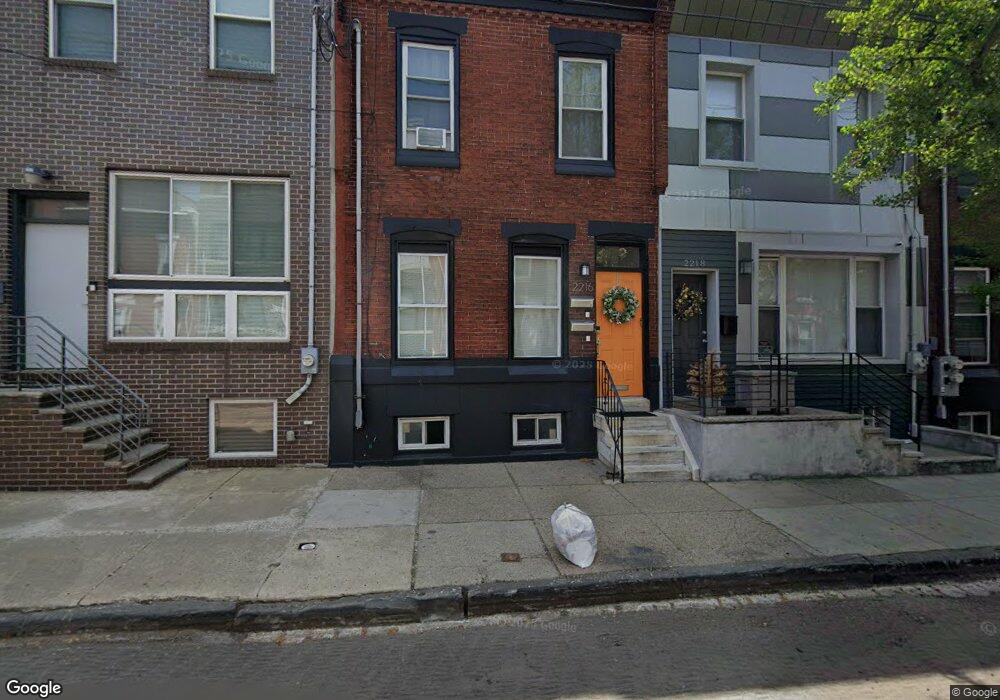
2216 Reed St Philadelphia, PA 19146
Point Breeze NeighborhoodEstimated Value: $342,000 - $409,000
2
Beds
1
Bath
1,236
Sq Ft
$304/Sq Ft
Est. Value
About This Home
This home is located at 2216 Reed St, Philadelphia, PA 19146 and is currently estimated at $375,500, approximately $303 per square foot. 2216 Reed St is a home located in Philadelphia County with nearby schools including South Philadelphia High School, Delaplaine McDaniel School, and St. Thomas Aquinas Catholic School.
Ownership History
Date
Name
Owned For
Owner Type
Purchase Details
Closed on
Jun 25, 2018
Sold by
Igt Group Llc
Bought by
Hoke Wayne R
Current Estimated Value
Home Financials for this Owner
Home Financials are based on the most recent Mortgage that was taken out on this home.
Original Mortgage
$265,109
Outstanding Balance
$228,791
Interest Rate
4.5%
Mortgage Type
FHA
Estimated Equity
$146,709
Purchase Details
Closed on
Oct 13, 2010
Sold by
Abikzer Erez
Bought by
Igt Group Llc
Home Financials for this Owner
Home Financials are based on the most recent Mortgage that was taken out on this home.
Original Mortgage
$75,000
Interest Rate
4.37%
Mortgage Type
Commercial
Purchase Details
Closed on
Nov 1, 2007
Sold by
Moore Bobbie M
Bought by
Abikzer Erez
Purchase Details
Closed on
Mar 22, 2000
Sold by
Trotman Fujike
Bought by
Moore Bobbie M
Create a Home Valuation Report for This Property
The Home Valuation Report is an in-depth analysis detailing your home's value as well as a comparison with similar homes in the area
Home Values in the Area
Average Home Value in this Area
Purchase History
| Date | Buyer | Sale Price | Title Company |
|---|---|---|---|
| Hoke Wayne R | -- | None Available | |
| Igt Group Llc | $50,000 | None Available | |
| Abikzer Erez | $68,000 | None Available | |
| Moore Bobbie M | -- | -- |
Source: Public Records
Mortgage History
| Date | Status | Borrower | Loan Amount |
|---|---|---|---|
| Open | Hoke Wayne R | $265,109 | |
| Previous Owner | Igt Group Llc | $75,000 |
Source: Public Records
Tax History Compared to Growth
Tax History
| Year | Tax Paid | Tax Assessment Tax Assessment Total Assessment is a certain percentage of the fair market value that is determined by local assessors to be the total taxable value of land and additions on the property. | Land | Improvement |
|---|---|---|---|---|
| 2026 | $4,507 | $229,700 | $45,940 | $183,760 |
| 2025 | $4,507 | $229,700 | $45,940 | $183,760 |
| 2024 | $4,507 | $229,700 | $45,940 | $183,760 |
| 2023 | $4,507 | $322,000 | $64,400 | $257,600 |
| 2022 | $2,486 | $322,000 | $64,400 | $257,600 |
| 2021 | $2,486 | $0 | $0 | $0 |
| 2020 | $2,486 | $0 | $0 | $0 |
| 2019 | $2,311 | $0 | $0 | $0 |
| 2018 | $987 | $0 | $0 | $0 |
| 2017 | $987 | $0 | $0 | $0 |
| 2016 | $987 | $0 | $0 | $0 |
| 2015 | $945 | $0 | $0 | $0 |
| 2014 | -- | $70,500 | $10,692 | $59,808 |
| 2012 | -- | $8,000 | $1,600 | $6,400 |
Source: Public Records
Map
Nearby Homes
- 2216 Reed St Unit 2
- 2216 Reed St Unit 2ND FLR
- 2218 Reed St
- 2214 Reed St
- 2220 Reed St
- 2212 Reed St
- 2222 Reed St
- 2210 Reed St
- 2224 Reed St
- 2208 Reed St
- 2223 Gerritt St
- 2217 Gerritt St
- 2226 Reed St
- 2221 Gerritt St
- 2219 Gerritt St
- 2225 Gerritt St
- 2215 Gerritt St
- 2213 Gerritt St
- 2227 Gerritt St
- 2228 Reed St