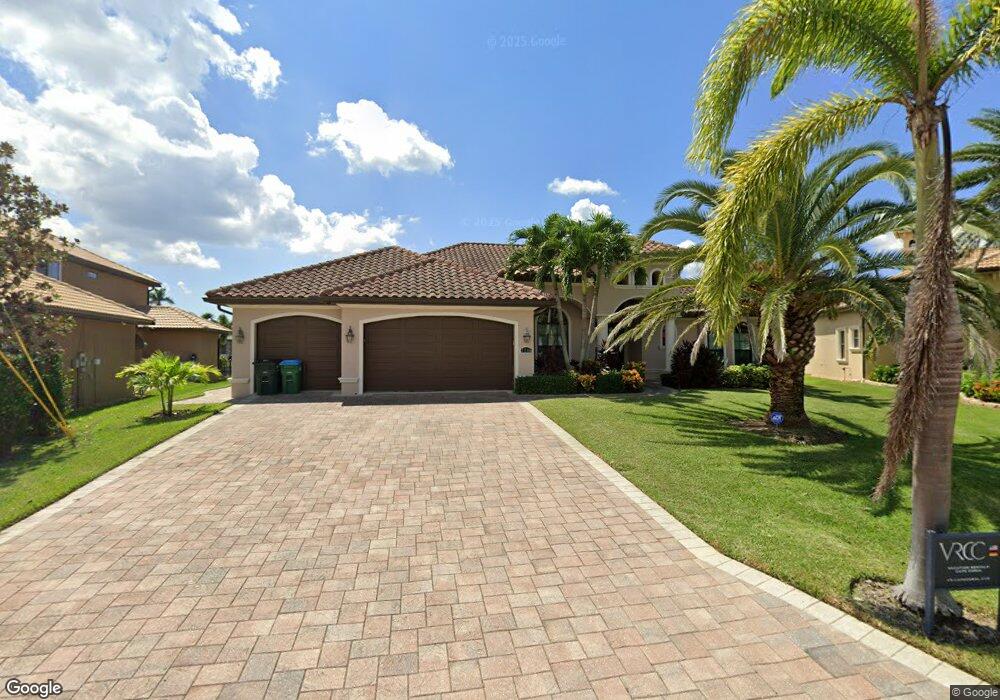
2216 SW 48th Terrace Cape Coral, FL 33914
Pelican NeighborhoodEstimated Value: $905,000 - $1,411,000
4
Beds
4
Baths
3,240
Sq Ft
$363/Sq Ft
Est. Value
About This Home
This home is located at 2216 SW 48th Terrace, Cape Coral, FL 33914 and is currently estimated at $1,175,006, approximately $362 per square foot. 2216 SW 48th Terrace is a home with nearby schools including Cape Elementary School, Caloosa Elementary School, and Tropic Isles Elementary School.
Ownership History
Date
Name
Owned For
Owner Type
Purchase Details
Closed on
Jun 28, 2012
Sold by
Anglo German Property Corp
Bought by
Bellin Ralf and Bellin Kornella
Current Estimated Value
Purchase Details
Closed on
May 3, 2000
Sold by
Volz Gerhard and Volz G
Bought by
Anglo German Prop Corp
Purchase Details
Closed on
Jan 12, 1999
Sold by
Schuermann Wilhelmus and Schuermann Ilse
Bought by
Volz Gerhard
Purchase Details
Closed on
Jun 5, 1998
Sold by
Gudvangen Guy and Gudvangen Dawn Marie
Bought by
Schuermann Wilhelmus and Schuermann Ilse
Home Financials for this Owner
Home Financials are based on the most recent Mortgage that was taken out on this home.
Original Mortgage
$49,000
Interest Rate
7.23%
Purchase Details
Closed on
Jan 17, 1995
Sold by
Buyers Behalf Realty Inc
Bought by
Gudvangen Guy and Gudvangen Dawn Marie
Home Financials for this Owner
Home Financials are based on the most recent Mortgage that was taken out on this home.
Original Mortgage
$44,000
Interest Rate
9.14%
Create a Home Valuation Report for This Property
The Home Valuation Report is an in-depth analysis detailing your home's value as well as a comparison with similar homes in the area
Home Values in the Area
Average Home Value in this Area
Purchase History
| Date | Buyer | Sale Price | Title Company |
|---|---|---|---|
| Bellin Ralf | $211,500 | Cape Coral Title Insurance A | |
| Anglo German Prop Corp | $77,000 | -- | |
| Volz Gerhard | $75,000 | -- | |
| Schuermann Wilhelmus | $70,000 | -- | |
| Gudvangen Guy | $60,000 | -- |
Source: Public Records
Mortgage History
| Date | Status | Borrower | Loan Amount |
|---|---|---|---|
| Previous Owner | Schuermann Wilhelmus | $49,000 | |
| Previous Owner | Gudvangen Guy | $44,000 |
Source: Public Records
Tax History Compared to Growth
Tax History
| Year | Tax Paid | Tax Assessment Tax Assessment Total Assessment is a certain percentage of the fair market value that is determined by local assessors to be the total taxable value of land and additions on the property. | Land | Improvement |
|---|---|---|---|---|
| 2025 | $18,664 | $1,225,050 | -- | -- |
| 2024 | $18,928 | $1,113,682 | -- | -- |
| 2023 | $18,928 | $1,012,438 | $0 | $0 |
| 2022 | $17,263 | $920,398 | $0 | $0 |
| 2021 | $15,311 | $837,823 | $272,438 | $565,385 |
| 2020 | $14,537 | $760,659 | $286,350 | $474,309 |
| 2019 | $14,593 | $766,308 | $289,800 | $476,508 |
| 2018 | $14,008 | $716,229 | $243,800 | $472,429 |
| 2017 | $15,123 | $772,788 | $243,800 | $528,988 |
| 2016 | $13,876 | $683,991 | $261,662 | $422,329 |
| 2015 | $14,250 | $692,612 | $227,773 | $464,839 |
| 2014 | -- | $240,736 | $240,736 | $0 |
| 2013 | -- | $152,900 | $152,900 | $0 |
Source: Public Records
Map
Nearby Homes
- 2122 SW 48th Terrace
- 2133 Cape Coral Pkwy W
- 2129 Cape Coral Pkwy W
- 2127 SW 49th Terrace Unit 69
- 4816 SW 24th Ave
- 4724 SW 23rd Ave
- 2300 SW 49th Terrace
- 4800 SW 24th Ave
- 4809 SW 24th Place
- 2102 SW 49th St Unit 69
- 4716 SW 23rd Ave
- 2217 SW 50th St
- 4728 SW 24th Ave
- 2212 SW 49th St
- 0 Access Undetermined Unit 224094813
- 0 Access Undetermined Unit 223081995
- 0 Access Undetermined Unit 223053494
- 0 Access Undetermined Unit 221084416
- 0 Access Undetermined Unit 16-17 218053060
- 0 Access Undetermined Unit 222058656
- 2212 SW 48th Terrace
- 2220 SW 48th Terrace
- 2208 SW 48th Terrace
- 2215 SW 48th Terrace
- 4808 SW 22nd Place Unit 39
- 4808 SW 22nd Place
- 2211 SW 48th Terrace
- 2204 SW 48th Terrace
- 2215 SW 49th St
- 2211 SW 49th St
- 2207 SW 48th Terrace
- 2214 Cape Coral Pkwy W
- 2214 Cape Coral Pkwy W Unit 1
- 2200 SW 48th Terrace
- 2205 SW 49th St
- 4802 SW 22nd Place
- 2219 SW 49th St
- 2210 Cape Coral Pkwy W
- 2203 SW 48th Terrace
- 2201 SW 49th St