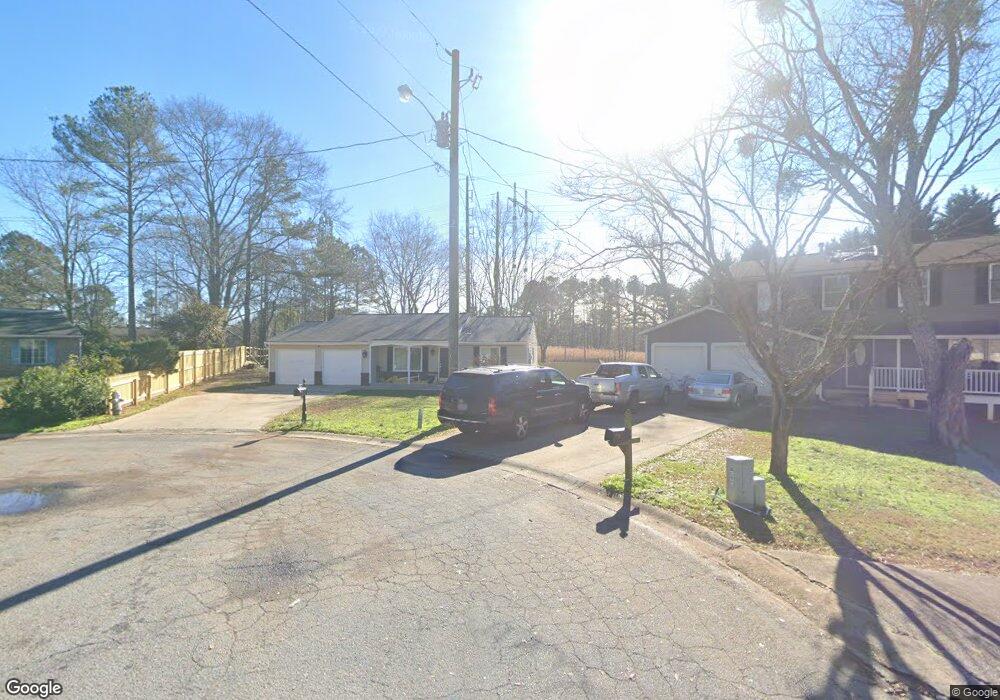
2217 Bridle Ct Norcross, GA 30071
Estimated Value: $252,000 - $345,717
3
Beds
2
Baths
1,132
Sq Ft
$263/Sq Ft
Est. Value
About This Home
This home is located at 2217 Bridle Ct, Norcross, GA 30071 and is currently estimated at $298,179, approximately $263 per square foot. 2217 Bridle Ct is a home located in Gwinnett County with nearby schools including Beaver Ridge Elementary School, Summerour Middle School, and Norcross High School.
Ownership History
Date
Name
Owned For
Owner Type
Purchase Details
Closed on
Jul 27, 2007
Sold by
Elliot Investments Inc
Bought by
Delgado Salvador
Current Estimated Value
Home Financials for this Owner
Home Financials are based on the most recent Mortgage that was taken out on this home.
Original Mortgage
$131,900
Outstanding Balance
$82,699
Interest Rate
6.65%
Mortgage Type
New Conventional
Estimated Equity
$215,480
Purchase Details
Closed on
Apr 6, 2006
Sold by
Chaairez Jose
Bought by
Elliot Investments Inc
Purchase Details
Closed on
Jan 31, 2001
Sold by
Perez Adela S
Bought by
Chairez Jose
Home Financials for this Owner
Home Financials are based on the most recent Mortgage that was taken out on this home.
Original Mortgage
$111,400
Interest Rate
7.03%
Mortgage Type
New Conventional
Purchase Details
Closed on
Apr 23, 1998
Sold by
Fox Bobby B
Bought by
Perez Adela Sanchez and Suazo Ricardo
Home Financials for this Owner
Home Financials are based on the most recent Mortgage that was taken out on this home.
Original Mortgage
$88,100
Interest Rate
7.1%
Mortgage Type
FHA
Create a Home Valuation Report for This Property
The Home Valuation Report is an in-depth analysis detailing your home's value as well as a comparison with similar homes in the area
Home Values in the Area
Average Home Value in this Area
Purchase History
| Date | Buyer | Sale Price | Title Company |
|---|---|---|---|
| Delgado Salvador | $131,900 | -- | |
| Elliot Investments Inc | $106,900 | -- | |
| Chairez Jose | $114,900 | -- | |
| Perez Adela Sanchez | $90,000 | -- |
Source: Public Records
Mortgage History
| Date | Status | Borrower | Loan Amount |
|---|---|---|---|
| Open | Delgado Salvador | $131,900 | |
| Previous Owner | Chairez Jose | $111,400 | |
| Previous Owner | Perez Adela Sanchez | $88,100 |
Source: Public Records
Tax History Compared to Growth
Tax History
| Year | Tax Paid | Tax Assessment Tax Assessment Total Assessment is a certain percentage of the fair market value that is determined by local assessors to be the total taxable value of land and additions on the property. | Land | Improvement |
|---|---|---|---|---|
| 2025 | $4,242 | $110,720 | $25,840 | $84,880 |
| 2024 | $3,802 | $97,120 | $25,600 | $71,520 |
| 2023 | $3,802 | $97,120 | $25,600 | $71,520 |
| 2022 | $3,434 | $87,920 | $23,200 | $64,720 |
| 2021 | $2,568 | $62,720 | $18,400 | $44,320 |
| 2020 | $2,471 | $59,680 | $16,000 | $43,680 |
| 2019 | $2,383 | $59,680 | $16,000 | $43,680 |
| 2018 | $1,990 | $48,520 | $13,600 | $34,920 |
| 2016 | $1,729 | $40,560 | $11,200 | $29,360 |
| 2015 | $1,458 | $32,400 | $8,000 | $24,400 |
| 2014 | $1,322 | $28,400 | $8,000 | $20,400 |
Source: Public Records
Map
Nearby Homes
- 5045 Racquet Ct
- 4880 Racquet Ct
- 2318 Ingram Rd
- 5041 Rockborough Trail Unit 3
- 4935 Rockborough Trail
- 5065 Rockborough Trail NW
- 4767 Glenwhite Dr
- 5055 Running Fox Trail
- 4787 Greenway Rd
- 5106 Rockborough Trail
- 4981 Sharp Way
- 2325 E Hill Way NW
- 2621 Bailey Dr
- 4242 Morrison Lake Trail
- 2385 Muirfield Way
- 4781 Valley Ridge Dr
- 4786 Masters Ct Unit 4
- 2037 Pinnacle Pointe Dr
- 2225 Bridle Ct
- 2224 Bridle Ct NW
- 2233 Bridle Ct
- 2188 Ranch Trail Unit 6
- 2194 Ranch Trail
- 2232 Bridle Ct
- 2241 Bridle Ct
- 2200 Ranch Trail Unit 6
- 2240 Bridle Ct
- 2206 Ranch Trail Unit 6
- 2212 Ranch Trail Unit 6
- 2221 Blacksmith Ct
- 2249 Bridle Ct
- 2213 Blacksmith Ct
- 2224 Ranch Trail
- 4872 Mustang Dr
- 2254 Ranch Trail
- 0 Ranch Trail Unit 7289897
- 0 Ranch Trail Unit 8268869
- 0 Ranch Trail Unit 7304971