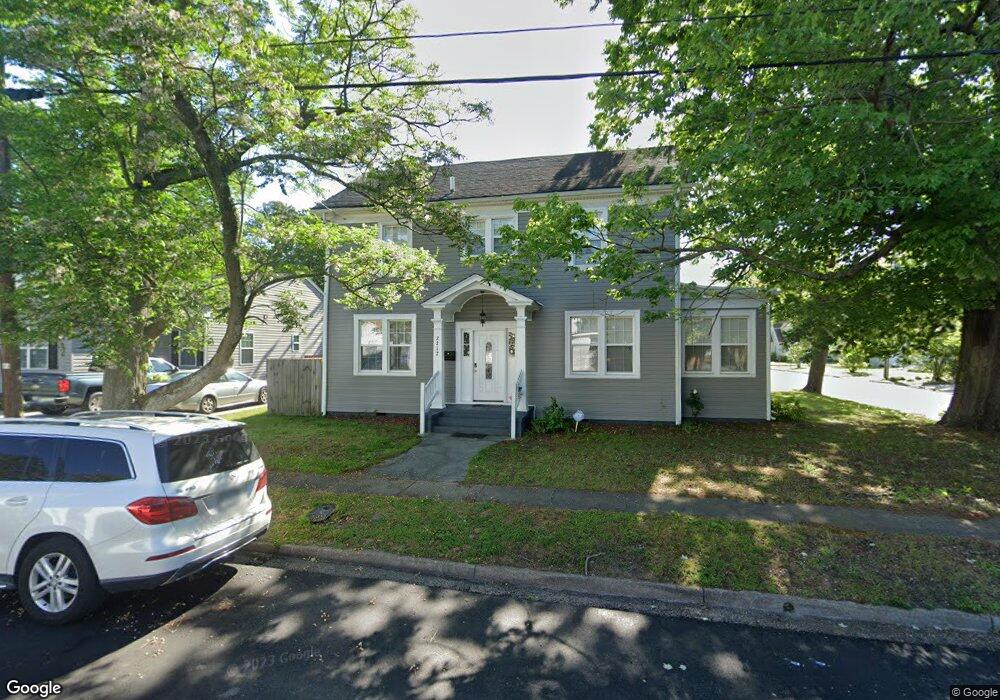
2217 Des Moines Ave Portsmouth, VA 23704
South Portsmouth NeighborhoodEstimated Value: $281,000 - $325,000
4
Beds
2
Baths
2,028
Sq Ft
$146/Sq Ft
Est. Value
About This Home
This home is located at 2217 Des Moines Ave, Portsmouth, VA 23704 and is currently estimated at $296,142, approximately $146 per square foot. 2217 Des Moines Ave is a home located in Portsmouth City with nearby schools including Douglass Park Elementary School, I.C. Norcom High School, and St Mark Christian Academy.
Ownership History
Date
Name
Owned For
Owner Type
Purchase Details
Closed on
Dec 30, 2021
Sold by
Ginley Jr Michael T
Bought by
Chugbo Vincent and Ozoh Francisca
Current Estimated Value
Home Financials for this Owner
Home Financials are based on the most recent Mortgage that was taken out on this home.
Original Mortgage
$221,000
Outstanding Balance
$203,289
Interest Rate
3.12%
Mortgage Type
New Conventional
Estimated Equity
$92,853
Purchase Details
Closed on
Jul 17, 2019
Sold by
Hernandez Kristle L Maldonado
Bought by
Ginley Michael T and Ginley Alexis M
Home Financials for this Owner
Home Financials are based on the most recent Mortgage that was taken out on this home.
Original Mortgage
$197,149
Interest Rate
3.82%
Mortgage Type
VA
Purchase Details
Closed on
Oct 2, 2018
Sold by
Smith Brown Marcia Corelia Smith and Smith Trotman Emma Pauline
Bought by
Hernandez Kristle L Maldonado
Create a Home Valuation Report for This Property
The Home Valuation Report is an in-depth analysis detailing your home's value as well as a comparison with similar homes in the area
Home Values in the Area
Average Home Value in this Area
Purchase History
| Date | Buyer | Sale Price | Title Company |
|---|---|---|---|
| Chugbo Vincent | $260,000 | Stewart Title Company | |
| Ginley Michael T | $193,000 | Attorney | |
| Hernandez Kristle L Maldonado | $38,500 | Attorney |
Source: Public Records
Mortgage History
| Date | Status | Borrower | Loan Amount |
|---|---|---|---|
| Open | Chugbo Vincent | $221,000 | |
| Previous Owner | Ginley Michael T | $197,149 |
Source: Public Records
Tax History Compared to Growth
Tax History
| Year | Tax Paid | Tax Assessment Tax Assessment Total Assessment is a certain percentage of the fair market value that is determined by local assessors to be the total taxable value of land and additions on the property. | Land | Improvement |
|---|---|---|---|---|
| 2025 | $3,334 | $261,460 | $57,810 | $203,650 |
| 2024 | $3,334 | $257,150 | $57,810 | $199,340 |
| 2023 | $2,998 | $239,870 | $57,810 | $182,060 |
| 2022 | $2,725 | $209,600 | $46,250 | $163,350 |
| 2021 | $2,365 | $181,890 | $38,700 | $143,190 |
| 2020 | $2,266 | $174,300 | $36,860 | $137,440 |
| 2019 | $1,752 | $134,780 | $36,860 | $97,920 |
| 2018 | $1,752 | $134,780 | $36,860 | $97,920 |
| 2017 | $1,752 | $134,780 | $36,860 | $97,920 |
| 2016 | $1,752 | $134,780 | $36,860 | $97,920 |
| 2015 | $1,685 | $129,590 | $36,860 | $92,730 |
| 2014 | $1,646 | $129,590 | $36,860 | $92,730 |
Source: Public Records
Map
Nearby Homes
- 2314 Charleston Ave
- 2207 Richmond Ave
- 1611 Highland Ave
- 2537 Staunton Ave
- 2014 Piedmont Ave
- 2002 Lansing Ave
- 2005 Piedmont Ave
- 2629 Roanoke Ave
- 2605 Roanoke Ave
- 2506 Oak St
- 2108 Atlanta Ave
- 2600 Roanoke Ave
- 1536 Centre Ave
- 1538 Centre Ave
- 1237 Portsmouth Blvd
- 1415 Summit Ave
- 1907 Azalea Ave
- 2009 Deep Creek Blvd
- 2108 Camden Ave
- 1315 Jefferson St
- 2209 Des Moines Ave
- 1903 Jefferson St
- 2228 Lansing Ave
- 2228 Lansing Ave Unit B
- 2228 Lansing Ave Unit A
- 2207 Des Moines Ave
- 2206 Lansing Ave
- 1901 Jefferson St
- 2201 Des Moines Ave
- 2212 Des Moines Ave
- 2208 Des Moines Ave
- 2305 Des Moines Ave
- 2200 Lansing Ave
- 2300 Des Moines Ave
- 2206 Des Moines Ave
- 2119 Des Moines Ave
- 2200 Des Moines Ave
- 2310 Lansing Ave
- 2313 Des Moines Ave
- 2116 Lansing Ave