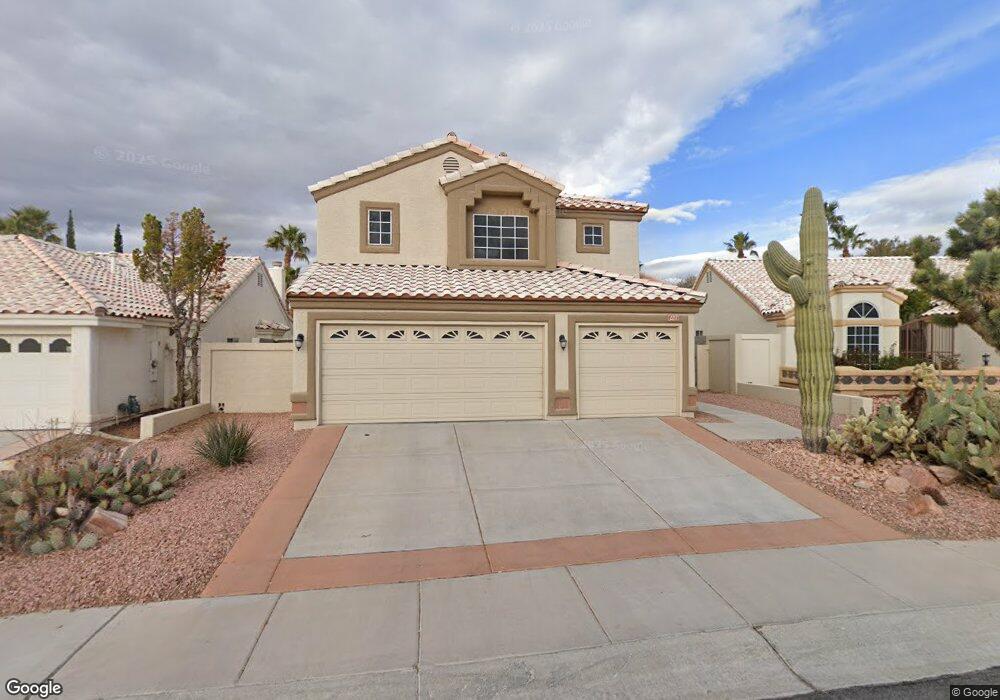
2217 Loggerhead Rd Las Vegas, NV 89117
Peccole Ranch NeighborhoodEstimated Value: $677,532 - $739,000
4
Beds
3
Baths
2,571
Sq Ft
$278/Sq Ft
Est. Value
About This Home
This home is located at 2217 Loggerhead Rd, Las Vegas, NV 89117 and is currently estimated at $714,883, approximately $278 per square foot. 2217 Loggerhead Rd is a home located in Clark County with nearby schools including Clarence A. Piggott Academy of International Studies, D'Vorre & Hal Ober Elementary School, and Walter Johnson Junior High School Academy of International Studies.
Ownership History
Date
Name
Owned For
Owner Type
Purchase Details
Closed on
May 11, 2011
Sold by
Vandenbergen Smith Janice
Bought by
Vandenbergen Smith Janice and Smith Kenneth W
Current Estimated Value
Purchase Details
Closed on
May 7, 2007
Sold by
Vandenbergen Smith Janice and Smith Kenneth W
Bought by
Vandenbergen Smith Janice
Home Financials for this Owner
Home Financials are based on the most recent Mortgage that was taken out on this home.
Original Mortgage
$199,000
Interest Rate
6.18%
Mortgage Type
New Conventional
Purchase Details
Closed on
Oct 15, 1999
Sold by
Vandenbergen Steven D and Vandenbergen Janice E
Bought by
Vandenbergen Janice E
Home Financials for this Owner
Home Financials are based on the most recent Mortgage that was taken out on this home.
Original Mortgage
$50,000
Interest Rate
7.82%
Create a Home Valuation Report for This Property
The Home Valuation Report is an in-depth analysis detailing your home's value as well as a comparison with similar homes in the area
Home Values in the Area
Average Home Value in this Area
Purchase History
| Date | Buyer | Sale Price | Title Company |
|---|---|---|---|
| Vandenbergen Smith Janice | -- | None Available | |
| Vandenbergen Smith Janice | -- | First Amer Title Co Of Nv | |
| Vandenbergen Janice E | -- | Nevada Title Company |
Source: Public Records
Mortgage History
| Date | Status | Borrower | Loan Amount |
|---|---|---|---|
| Closed | Vandenbergen Smith Janice | $199,000 | |
| Closed | Vandenbergen Janice E | $50,000 |
Source: Public Records
Tax History Compared to Growth
Tax History
| Year | Tax Paid | Tax Assessment Tax Assessment Total Assessment is a certain percentage of the fair market value that is determined by local assessors to be the total taxable value of land and additions on the property. | Land | Improvement |
|---|---|---|---|---|
| 2025 | $3,438 | $146,423 | $60,550 | $85,873 |
| 2024 | $3,338 | $146,423 | $60,550 | $85,873 |
| 2023 | $3,338 | $127,254 | $45,150 | $82,104 |
| 2022 | $3,241 | $120,240 | $44,450 | $75,790 |
| 2021 | $3,147 | $109,220 | $36,750 | $72,470 |
| 2020 | $3,052 | $109,046 | $36,750 | $72,296 |
| 2019 | $2,963 | $102,248 | $30,800 | $71,448 |
| 2018 | $2,877 | $96,707 | $27,650 | $69,057 |
| 2017 | $3,193 | $97,368 | $26,950 | $70,418 |
| 2016 | $2,724 | $93,750 | $23,100 | $70,650 |
| 2015 | $2,719 | $82,187 | $20,300 | $61,887 |
| 2014 | $2,639 | $78,099 | $10,500 | $67,599 |
Source: Public Records
Map
Nearby Homes
- 2112 Marble Gorge Dr
- 2105 Madagascar Ln
- 2112 Preakness Pass Unit A
- 2101 Quartz Cliff St Unit 207
- 2153 Jade Creek St Unit 106
- 2052 Jade Creek St Unit 202
- 2300 Storkspur Way
- 2053 Jade Creek St Unit 206
- 1913 Madagascar Ln
- 2052 Gravel Hill St Unit 207
- 2052 Gravel Hill St Unit 201
- 2000 Gravel Hill St Unit 203
- 2053 Gravel Hill St Unit 203
- 9705 Floweret Ave
- 1905 Shifting Winds St
- 2152 Turquoise Ridge St Unit 202
- 2021 Summit Pointe Dr
- 9917 Dusty Winds Ave
- 1705 Warrenville St
- 2316 Summer Home St
- 2213 Loggerhead Rd
- 2221 Loggerhead Rd
- 2200 Marble Gorge Dr
- 2124 Marble Gorge Dr
- 2225 Loggerhead Rd
- 2209 Loggerhead Rd
- 2208 Marble Gorge Dr
- 2120 Marble Gorge Dr
- 2216 Loggerhead Rd Unit B
- 2220 Loggerhead Rd
- 2229 Loggerhead Rd
- 2208 Loggerhead Rd
- 2116 Marble Gorge Dr
- 2205 Loggerhead Rd
- 9704 Maltese Way
- 2204 Loggerhead Rd
- 9700 Maltese Way
- 9701 Quail Springs Ct
- 2201 Marble Gorge Dr
- 2125 Marble Gorge Dr