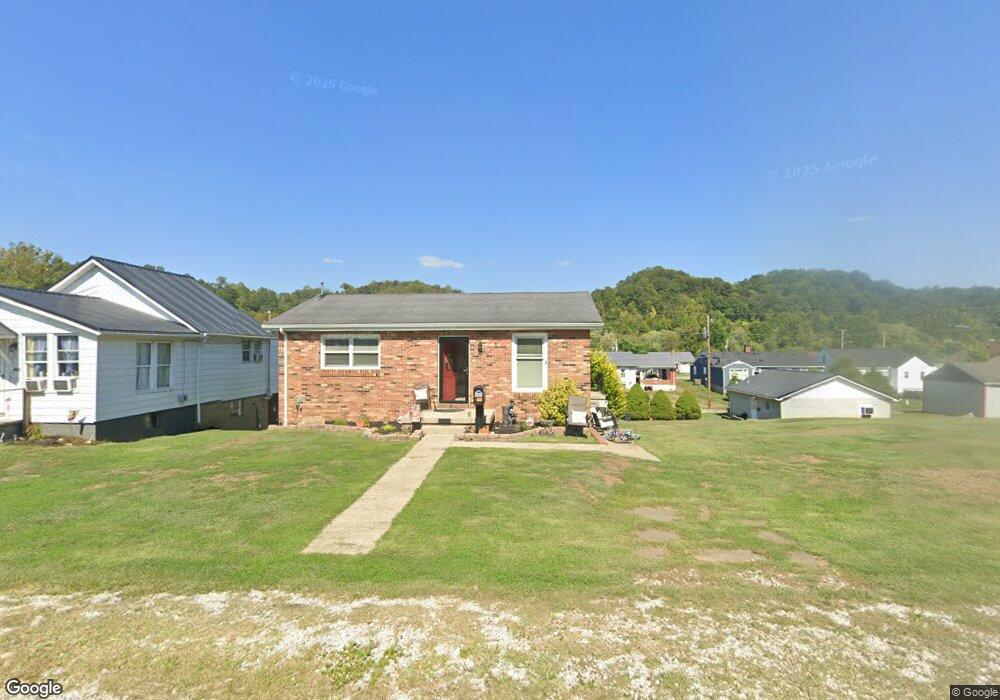
2217 N 3rd St Ironton, OH 45638
Estimated Value: $85,000 - $136,000
2
Beds
2
Baths
832
Sq Ft
$143/Sq Ft
Est. Value
About This Home
This home is located at 2217 N 3rd St, Ironton, OH 45638 and is currently estimated at $118,753, approximately $142 per square foot. 2217 N 3rd St is a home located in Lawrence County with nearby schools including Ironton Elementary School, Ironton Middle School, and Ironton High School.
Ownership History
Date
Name
Owned For
Owner Type
Purchase Details
Closed on
Dec 21, 2009
Sold by
Hankins Joe
Bought by
Hankins Stacie
Current Estimated Value
Purchase Details
Closed on
Jun 25, 2002
Bought by
Tipton Nancy J
Purchase Details
Closed on
Jan 10, 1994
Sold by
Morris Virginia Eileen
Bought by
Morris, Eileen Trustee
Purchase Details
Closed on
May 3, 1993
Sold by
Harrison Robert L and Harrison Car
Bought by
Morris Virginia Eileen
Purchase Details
Closed on
Jun 6, 1988
Sold by
Morris Ralph E and Morris Billi
Bought by
Harrison Robert L and Harrison Car
Create a Home Valuation Report for This Property
The Home Valuation Report is an in-depth analysis detailing your home's value as well as a comparison with similar homes in the area
Home Values in the Area
Average Home Value in this Area
Purchase History
| Date | Buyer | Sale Price | Title Company |
|---|---|---|---|
| Hankins Stacie | -- | Attorney | |
| Tipton Nancy J | -- | -- | |
| Morris, Eileen Trustee | -- | -- | |
| Morris Virginia Eileen | $44,500 | -- | |
| Harrison Robert L | $42,300 | -- |
Source: Public Records
Tax History Compared to Growth
Tax History
| Year | Tax Paid | Tax Assessment Tax Assessment Total Assessment is a certain percentage of the fair market value that is determined by local assessors to be the total taxable value of land and additions on the property. | Land | Improvement |
|---|---|---|---|---|
| 2024 | -- | $30,830 | $4,240 | $26,590 |
| 2023 | $1,113 | $30,830 | $4,240 | $26,590 |
| 2022 | $1,112 | $30,830 | $4,240 | $26,590 |
| 2021 | $1,091 | $29,040 | $3,540 | $25,500 |
| 2020 | $1,107 | $29,040 | $3,540 | $25,500 |
| 2019 | $1,103 | $29,040 | $3,540 | $25,500 |
| 2018 | $1,015 | $26,400 | $3,220 | $23,180 |
| 2017 | $1,013 | $26,400 | $3,220 | $23,180 |
| 2016 | $950 | $26,400 | $3,220 | $23,180 |
| 2015 | $838 | $22,430 | $3,540 | $18,890 |
| 2014 | $808 | $22,430 | $3,540 | $18,890 |
| 2013 | $806 | $22,430 | $3,540 | $18,890 |
Source: Public Records
Map
Nearby Homes