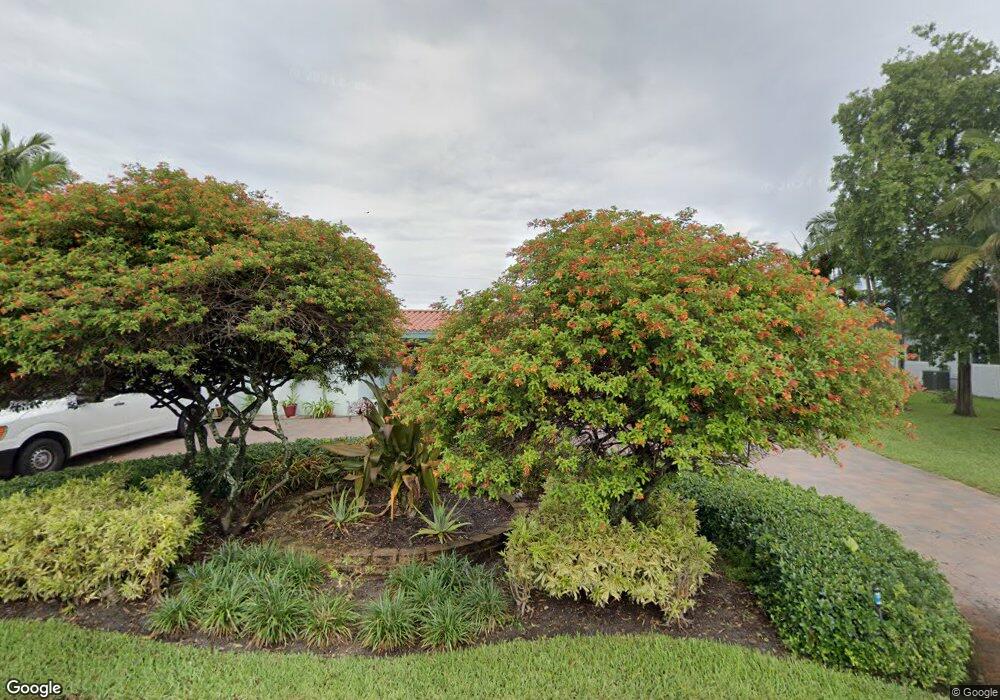
2217 NW 3rd Ave Wilton Manors, FL 33311
Estimated Value: $622,000 - $775,363
2
Beds
2
Baths
1,845
Sq Ft
$378/Sq Ft
Est. Value
About This Home
This home is located at 2217 NW 3rd Ave, Wilton Manors, FL 33311 and is currently estimated at $697,091, approximately $377 per square foot. 2217 NW 3rd Ave is a home located in Broward County with nearby schools including Wilton Manors Elementary School, Sunrise Middle School, and Fort Lauderdale High School.
Ownership History
Date
Name
Owned For
Owner Type
Purchase Details
Closed on
Feb 24, 2025
Sold by
Prime Housing Solutions Llc
Bought by
Aa & Adr Consulting Llc
Current Estimated Value
Purchase Details
Closed on
Feb 7, 2025
Sold by
Millman Neal E and Wurl Brian Christian
Bought by
Prime Housing Solutions Llc
Purchase Details
Closed on
Feb 7, 2019
Sold by
Millman Neal E
Bought by
Millman Neal E and Wuri Brian Christina
Purchase Details
Closed on
Feb 10, 2011
Sold by
Millman Neal
Bought by
Millman Neal E and Wurl Brian
Purchase Details
Closed on
Sep 17, 2003
Sold by
Millman Neal
Bought by
Millman Neal
Purchase Details
Closed on
Mar 16, 2001
Sold by
Available Not
Bought by
Available Not
Purchase Details
Closed on
Jun 7, 2000
Sold by
Keida Susan M
Bought by
Silverman Kenny
Purchase Details
Closed on
Dec 1, 1992
Sold by
Available Not
Bought by
Available Not
Create a Home Valuation Report for This Property
The Home Valuation Report is an in-depth analysis detailing your home's value as well as a comparison with similar homes in the area
Home Values in the Area
Average Home Value in this Area
Purchase History
| Date | Buyer | Sale Price | Title Company |
|---|---|---|---|
| Aa & Adr Consulting Llc | $675,000 | None Listed On Document | |
| Prime Housing Solutions Llc | $602,000 | None Listed On Document | |
| Millman Neal E | -- | Attorney | |
| Millman Neal E | -- | Attorney | |
| Millman Neal | -- | -- | |
| Available Not | $243,200 | -- | |
| Silverman Kenny | $163,000 | -- | |
| Available Not | $87,900 | -- |
Source: Public Records
Tax History Compared to Growth
Tax History
| Year | Tax Paid | Tax Assessment Tax Assessment Total Assessment is a certain percentage of the fair market value that is determined by local assessors to be the total taxable value of land and additions on the property. | Land | Improvement |
|---|---|---|---|---|
| 2025 | $5,638 | $307,130 | -- | -- |
| 2024 | $5,380 | $298,480 | -- | -- |
| 2023 | $5,380 | $289,790 | $0 | $0 |
| 2022 | $5,101 | $281,350 | $0 | $0 |
| 2021 | $4,900 | $270,830 | $0 | $0 |
| 2020 | $4,824 | $267,100 | $0 | $0 |
| 2019 | $4,711 | $261,100 | $0 | $0 |
| 2018 | $4,587 | $256,240 | $0 | $0 |
| 2017 | $4,553 | $250,970 | $0 | $0 |
| 2016 | $4,559 | $245,810 | $0 | $0 |
| 2015 | $4,646 | $244,110 | $0 | $0 |
| 2014 | $4,658 | $242,180 | $0 | $0 |
| 2013 | -- | $329,600 | $52,490 | $277,110 |
Source: Public Records
Map
Nearby Homes
- 300 NW 21st Ct
- 2116 NW 3rd Ave
- 2109 NW 2nd Ave
- 316 NW 24th St
- 241 NW 24th St
- 509 NW 21st St
- 400 NW 20th St
- 72 NE 20th Ct Unit 4C
- 185 NE 20th Ct Unit 9F
- 59 NE 20th Ct
- 40 NE 24th St
- 90 NE 21st Ct
- 616 NW 21st St
- 610 Tennis Club Dr Unit 408W
- 41 NE 24th St
- 620 Tennis Club Dr Unit 111
- 620 Tennis Club Dr Unit 311
- 501 NW 25th St
- 1950 N Andrews Ave Unit 210D
- 1950 N Andrews Ave Unit 120D
- 2209 NW 3rd Ave
- 2216 NW 4th Ave
- 2224 NW 4th Ave Unit ID1323988P
- 2224 NW 4th Ave
- 2208 NW 4th Ave
- 2226 NW 3rd Ave
- 2214 NW 3rd Ave
- 232 NW 23rd St Unit 2
- 232 NW 23rd St
- 2304 NW 3rd Ave Unit N
- 2208 NW 3rd Ave
- 2120 NW 4th St
- 2200 NW 4th Ave
- 2217 NW 2nd Ave
- 2225 NW 2nd Ave
- 2217 NW 4th Ave
- 2209 NW 2nd Ave
- 301 NW 23rd St
- 2233 NW 2nd Ave
- 317 NW 23rd St