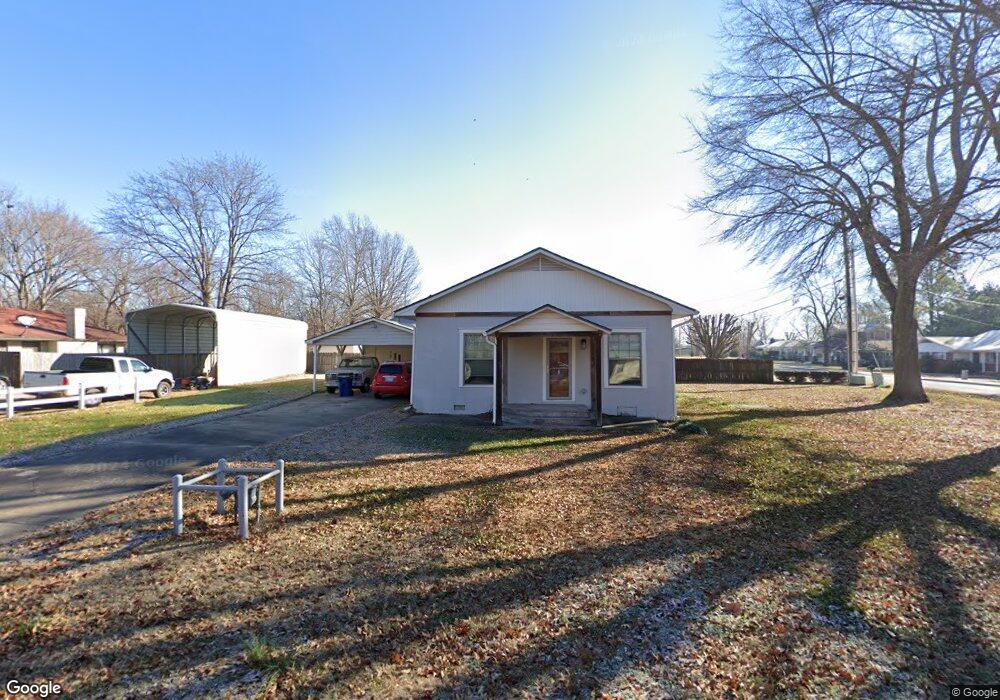
2217 S Mount Olive St Siloam Springs, AR 72761
Estimated Value: $180,402 - $206,000
--
Bed
1
Bath
1,093
Sq Ft
$179/Sq Ft
Est. Value
About This Home
This home is located at 2217 S Mount Olive St, Siloam Springs, AR 72761 and is currently estimated at $196,101, approximately $179 per square foot. 2217 S Mount Olive St is a home located in Benton County with nearby schools including Northside Elementary School, Southside Elementary School, and Delbert Pete & Pat Allen Elementary School.
Ownership History
Date
Name
Owned For
Owner Type
Purchase Details
Closed on
Mar 9, 2017
Sold by
Hall Alvin D and Hall Janet K
Bought by
Buckley Mike and Buckley Shirley
Current Estimated Value
Purchase Details
Closed on
Feb 25, 2000
Bought by
City Of Siloam
Purchase Details
Closed on
Aug 27, 1990
Bought by
Hall A
Purchase Details
Closed on
Aug 5, 1982
Bought by
Hall
Purchase Details
Closed on
Nov 8, 1978
Bought by
Potter
Create a Home Valuation Report for This Property
The Home Valuation Report is an in-depth analysis detailing your home's value as well as a comparison with similar homes in the area
Home Values in the Area
Average Home Value in this Area
Purchase History
| Date | Buyer | Sale Price | Title Company |
|---|---|---|---|
| Buckley Mike | $45,000 | None Available | |
| City Of Siloam | -- | -- | |
| Hall A | -- | -- | |
| Hall | $29,000 | -- | |
| Potter | $25,000 | -- |
Source: Public Records
Tax History Compared to Growth
Tax History
| Year | Tax Paid | Tax Assessment Tax Assessment Total Assessment is a certain percentage of the fair market value that is determined by local assessors to be the total taxable value of land and additions on the property. | Land | Improvement |
|---|---|---|---|---|
| 2025 | $1,547 | $32,471 | $7,400 | $25,071 |
| 2024 | $1,456 | $32,471 | $7,400 | $25,071 |
| 2023 | $1,323 | $25,410 | $5,600 | $19,810 |
| 2022 | $1,220 | $25,410 | $5,600 | $19,810 |
| 2021 | $1,115 | $25,410 | $5,600 | $19,810 |
| 2020 | $1,017 | $17,660 | $5,600 | $12,060 |
| 2019 | $1,017 | $17,660 | $5,600 | $12,060 |
| 2018 | $1,017 | $17,660 | $5,600 | $12,060 |
| 2017 | $482 | $11,350 | $5,600 | $5,750 |
| 2016 | $90 | $11,350 | $5,600 | $5,750 |
| 2015 | $419 | $7,280 | $1,600 | $5,680 |
| 2014 | $69 | $7,280 | $1,600 | $5,680 |
Source: Public Records
Map
Nearby Homes
- 214 Lake Francis Dr
- 110 Cordes Dr
- 0 S Mount Olive St
- 419 W Hannibal St
- 2503 Chanel St
- 2711 Summitt Dr
- 2786 S Olive Ct
- 820 W Deer Lodge Ct
- 412 W Kenwood St
- 2210 E Fennec St
- 0 S Carl St
- 0 Tbd Hwy 412 W
- TBD W 412 Hwy
- 817 S Katlyn Dr
- 716 S Washington St
- 0000 Elm St S
- 1218 E Kenwood St
- 1413 E Emelyn Ln
- 1208 Jo Lynn St
- 622 S Wright St
- 109 Lake Francis Dr
- 2185 S Mount Olive St
- 102 W Highland St
- 113 Lake Francis Dr
- 2127 S Mount Olive St
- 103 Magnolia St
- 102 Lake Francis Dr
- 2120 S Mount Olive St
- 2275 S Mount Olive St
- 114 W Highland St
- 109 Magnolia St
- 2160 Wood Tree Ct
- 2158 Wood Tree Ct
- 2156 Wood Tree Ct
- 2102 S Mount Olive St
- 2154 Wood Tree Ct
- 115 Magnolia St
- 2305 S Mount Olive St
- 218 Lake Francis Dr
- 102 Magnolia St