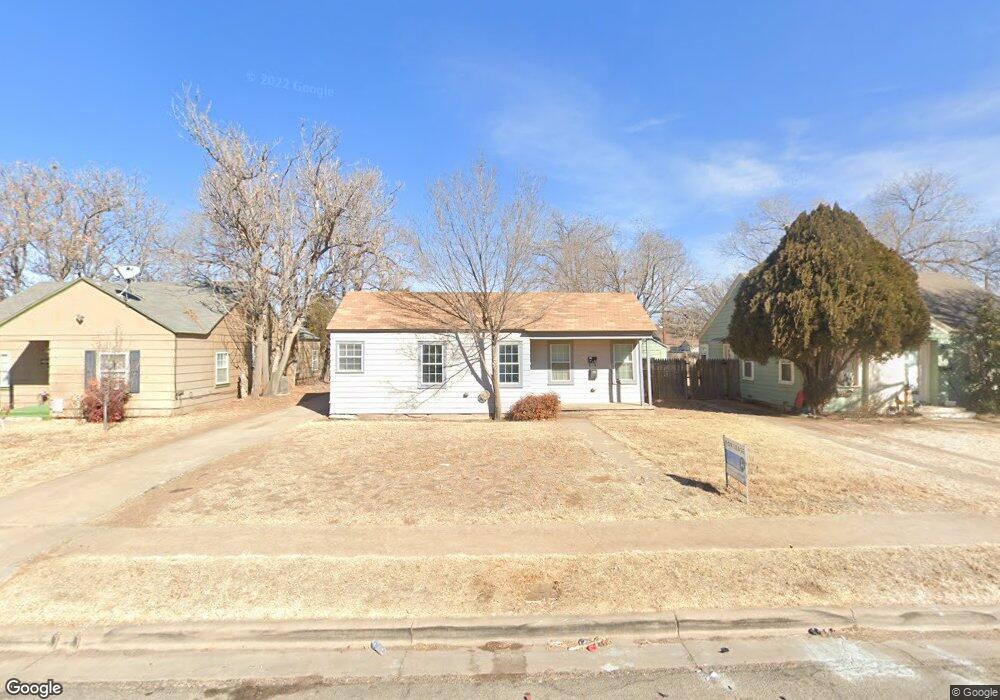
2218 21st St Unit Rear Lubbock, TX 79411
Heart of Lubbock NeighborhoodEstimated Value: $85,000 - $140,855
1
Bed
1
Bath
600
Sq Ft
$205/Sq Ft
Est. Value
About This Home
This home is located at 2218 21st St Unit Rear, Lubbock, TX 79411 and is currently estimated at $122,964, approximately $204 per square foot. 2218 21st St Unit Rear is a home located in Lubbock County with nearby schools including Brown Elementary School, Slaton Middle School, and Monterey High School.
Ownership History
Date
Name
Owned For
Owner Type
Purchase Details
Closed on
Feb 28, 2023
Sold by
Paul Jeanan Y
Bought by
Page Joshua
Current Estimated Value
Home Financials for this Owner
Home Financials are based on the most recent Mortgage that was taken out on this home.
Original Mortgage
$86,250
Outstanding Balance
$75,723
Interest Rate
5.17%
Mortgage Type
New Conventional
Estimated Equity
$47,241
Purchase Details
Closed on
Jun 4, 2009
Sold by
Nguyen Si Huu and Nguyen Hop Thi
Bought by
Paul Jeanan Y
Create a Home Valuation Report for This Property
The Home Valuation Report is an in-depth analysis detailing your home's value as well as a comparison with similar homes in the area
Home Values in the Area
Average Home Value in this Area
Purchase History
| Date | Buyer | Sale Price | Title Company |
|---|---|---|---|
| Page Joshua | -- | Title One | |
| Paul Jeanan Y | -- | Service Title |
Source: Public Records
Mortgage History
| Date | Status | Borrower | Loan Amount |
|---|---|---|---|
| Open | Page Joshua | $86,250 |
Source: Public Records
Tax History
| Year | Tax Paid | Tax Assessment Tax Assessment Total Assessment is a certain percentage of the fair market value that is determined by local assessors to be the total taxable value of land and additions on the property. | Land | Improvement |
|---|---|---|---|---|
| 2025 | $3,077 | $144,630 | $25,000 | $119,630 |
| 2024 | $31 | $169,432 | $25,000 | $144,432 |
| 2023 | $2,613 | $140,575 | $13,650 | $126,925 |
| 2022 | $2,654 | $131,092 | $13,650 | $117,442 |
| 2021 | $2,110 | $98,532 | $13,650 | $84,882 |
| 2020 | $2,171 | $99,858 | $13,650 | $86,208 |
| 2019 | $1,944 | $86,596 | $13,650 | $72,946 |
| 2018 | $2,021 | $89,912 | $13,650 | $76,262 |
| 2017 | $1,853 | $82,327 | $2,750 | $79,577 |
| 2016 | $1,763 | $78,348 | $2,750 | $75,598 |
| 2015 | $1,616 | $76,867 | $2,750 | $74,117 |
| 2014 | $1,616 | $72,662 | $2,750 | $69,912 |
Source: Public Records
Map
Nearby Homes
Your Personal Tour Guide
Ask me questions while you tour the home.