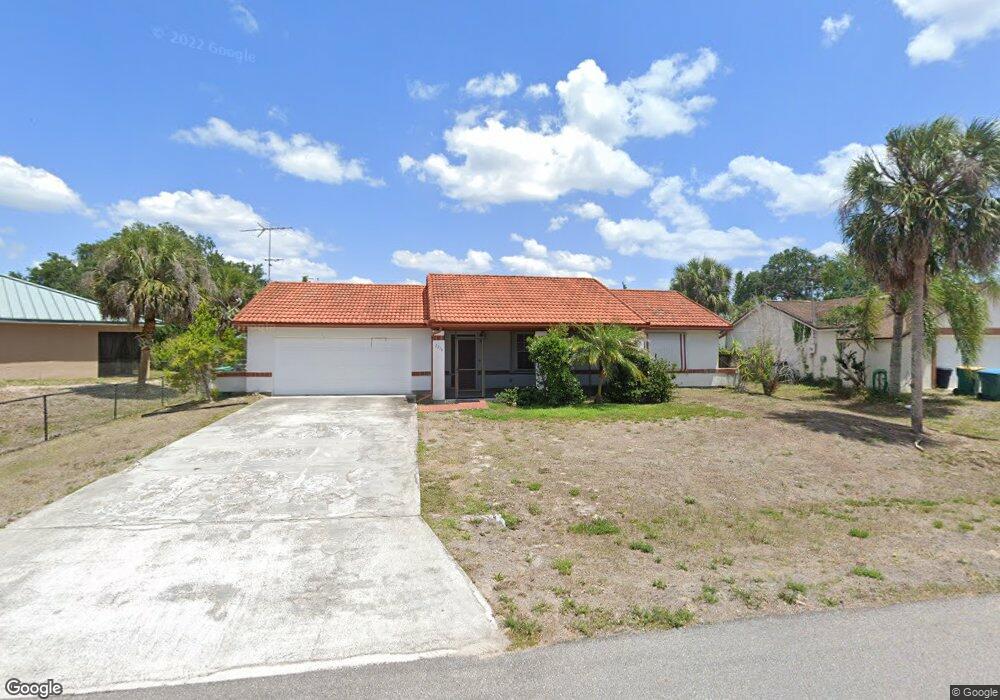
2218 Arnet St Port Charlotte, FL 33948
Estimated Value: $202,962 - $279,000
2
Beds
2
Baths
1,878
Sq Ft
$131/Sq Ft
Est. Value
About This Home
This home is located at 2218 Arnet St, Port Charlotte, FL 33948 and is currently estimated at $246,741, approximately $131 per square foot. 2218 Arnet St is a home located in Charlotte County with nearby schools including Liberty Elementary School, Murdock Middle School, and Port Charlotte High School.
Ownership History
Date
Name
Owned For
Owner Type
Purchase Details
Closed on
Oct 12, 2018
Sold by
Vowell Alford W and Vowell Robin E
Bought by
Vowell Alford Wayne and Vowell Robin Elaine
Current Estimated Value
Purchase Details
Closed on
Mar 3, 2011
Sold by
Baker Frederick A
Bought by
Baker Frederick A and Baker Betty Colleen
Purchase Details
Closed on
Jan 11, 2011
Sold by
M & I Bank
Bought by
Baker Frederick A
Purchase Details
Closed on
Sep 30, 2010
Sold by
Lawrence Diane and Case #08-2008-Ca-006263
Bought by
M & I Bank
Purchase Details
Closed on
Apr 7, 2006
Sold by
Smith Joan H and Smith Brent Truitt
Bought by
Lawrence Diane
Home Financials for this Owner
Home Financials are based on the most recent Mortgage that was taken out on this home.
Original Mortgage
$130,000
Interest Rate
6.29%
Mortgage Type
Fannie Mae Freddie Mac
Purchase Details
Closed on
Jan 5, 1996
Sold by
Cupery Ryan E
Bought by
Smith Joan H and Smith Brent Truitt
Create a Home Valuation Report for This Property
The Home Valuation Report is an in-depth analysis detailing your home's value as well as a comparison with similar homes in the area
Home Values in the Area
Average Home Value in this Area
Purchase History
| Date | Buyer | Sale Price | Title Company |
|---|---|---|---|
| Vowell Alford Wayne | -- | Attorney | |
| Baker Frederick A | -- | None Available | |
| Baker Frederick A | $37,500 | Sonoran Title Services Inc | |
| M & I Bank | $20,100 | None Available | |
| Lawrence Diane | $175,000 | Banyan Escrow & Securities T | |
| Smith Joan H | -- | -- |
Source: Public Records
Mortgage History
| Date | Status | Borrower | Loan Amount |
|---|---|---|---|
| Previous Owner | Lawrence Diane | $130,000 |
Source: Public Records
Tax History Compared to Growth
Tax History
| Year | Tax Paid | Tax Assessment Tax Assessment Total Assessment is a certain percentage of the fair market value that is determined by local assessors to be the total taxable value of land and additions on the property. | Land | Improvement |
|---|---|---|---|---|
| 2023 | $3,057 | $128,838 | $0 | $0 |
| 2022 | $2,712 | $142,471 | $13,175 | $129,296 |
| 2021 | $2,435 | $106,477 | $5,270 | $101,207 |
| 2020 | $2,351 | $109,132 | $4,760 | $104,372 |
| 2019 | $2,143 | $97,963 | $4,335 | $93,628 |
| 2018 | $1,829 | $80,861 | $4,675 | $76,186 |
| 2017 | $1,761 | $75,760 | $3,672 | $72,088 |
| 2016 | $1,698 | $70,798 | $0 | $0 |
| 2015 | $1,502 | $53,764 | $0 | $0 |
| 2014 | $1,364 | $48,876 | $0 | $0 |
Source: Public Records
Map
Nearby Homes
- 2120 Bendway Dr
- 2212 Bendway Dr
- 2055 Bendway Dr
- 2063 Bendway Dr
- 18088 Windingvail Ave
- 18183 Windingvail Ave
- 18071 Windswept Ave
- 18080 Windswept Ave
- 2272 Auburn Blvd
- 18161 Windswept Ave
- 2256 Auburn Blvd
- 2151 Corfell St
- 18087 Clanton Ave
- 2399 Bendway Dr
- 2145 Winningway St
- 2281 Barksdale St
- 2424 Auburn Blvd
- 17512 Marcy Ave
- 17513 Marcy Ave
- 17504 Granby Ave
- 2218 Street
- 2226 Arnet St
- 18087 Windingvail Ave
- 2227 Baybell St
- 2219 Arnet St
- 2219 Arnet St
- 2219 Arnet St Unit 2666715-79059
- 2219 Arnet St
- 18071 Windingvail Ave
- 2237 Baybell St
- 18167 & 18175 Summerdown Ave
- 2120 Bendway Dr Unit 7
- 2247 Bendway Dr
- 2239 Bendway Dr
- 2303 Bendway Dr
- 2111 Bendway Dr
- 2207 & 2215 Bendway Dr
- 18096 Windingvail Ave
- 18056 Windingvail Ave Corfell St
- 2304 Bendway Dr