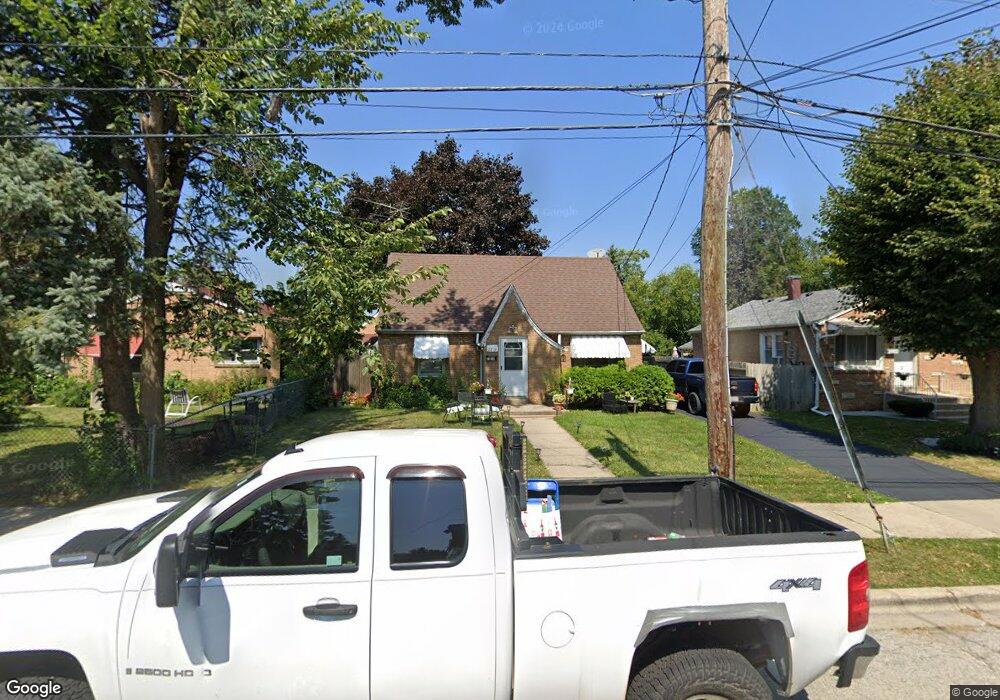
2218 Catalpa St Waukegan, IL 60085
West Waukegan NeighborhoodEstimated Value: $219,698 - $251,000
2
Beds
1
Bath
1,296
Sq Ft
$180/Sq Ft
Est. Value
About This Home
This home is located at 2218 Catalpa St, Waukegan, IL 60085 and is currently estimated at $233,675, approximately $180 per square foot. 2218 Catalpa St is a home located in Lake County with nearby schools including Washington Elementary School, Robert E. Abbott Middle School, and Waukegan High School.
Ownership History
Date
Name
Owned For
Owner Type
Purchase Details
Closed on
Feb 12, 2023
Sold by
Marban Mardonio
Bought by
Marban Mardonio
Current Estimated Value
Home Financials for this Owner
Home Financials are based on the most recent Mortgage that was taken out on this home.
Original Mortgage
$125,500
Outstanding Balance
$110,539
Interest Rate
5.5%
Mortgage Type
New Conventional
Estimated Equity
$123,136
Purchase Details
Closed on
Feb 10, 2005
Sold by
Marban Gildardo and Marban Oscar
Bought by
Marban Mardonio and Marban Oscar
Home Financials for this Owner
Home Financials are based on the most recent Mortgage that was taken out on this home.
Original Mortgage
$140,250
Interest Rate
6.25%
Mortgage Type
Unknown
Purchase Details
Closed on
Sep 25, 2002
Sold by
Bates Martha Jean
Bought by
Marban Gildardo and Marban Oscar
Home Financials for this Owner
Home Financials are based on the most recent Mortgage that was taken out on this home.
Original Mortgage
$128,976
Interest Rate
5.87%
Mortgage Type
FHA
Create a Home Valuation Report for This Property
The Home Valuation Report is an in-depth analysis detailing your home's value as well as a comparison with similar homes in the area
Home Values in the Area
Average Home Value in this Area
Purchase History
| Date | Buyer | Sale Price | Title Company |
|---|---|---|---|
| Marban Mardonio | -- | -- | |
| Marban Mardonio | -- | Ctic | |
| Marban Gildardo | $131,000 | Chicago Title Insurance Comp |
Source: Public Records
Mortgage History
| Date | Status | Borrower | Loan Amount |
|---|---|---|---|
| Open | Marban Mardonio | $125,500 | |
| Previous Owner | Marban Mardonio | $140,250 | |
| Previous Owner | Marban Gildardo | $128,976 |
Source: Public Records
Tax History Compared to Growth
Tax History
| Year | Tax Paid | Tax Assessment Tax Assessment Total Assessment is a certain percentage of the fair market value that is determined by local assessors to be the total taxable value of land and additions on the property. | Land | Improvement |
|---|---|---|---|---|
| 2024 | $3,934 | $55,586 | $6,743 | $48,843 |
| 2023 | $3,948 | $49,723 | $6,032 | $43,691 |
| 2022 | $3,948 | $46,384 | $5,355 | $41,029 |
| 2021 | $3,414 | $38,749 | $4,606 | $34,143 |
| 2020 | $3,412 | $36,099 | $4,291 | $31,808 |
| 2019 | $3,381 | $33,079 | $3,932 | $29,147 |
| 2018 | $2,991 | $29,513 | $7,235 | $22,278 |
| 2017 | $2,861 | $26,111 | $6,401 | $19,710 |
| 2016 | $2,579 | $22,689 | $5,562 | $17,127 |
| 2015 | $2,417 | $20,307 | $4,978 | $15,329 |
| 2014 | $3,191 | $24,398 | $5,111 | $19,287 |
| 2012 | $4,175 | $26,434 | $5,538 | $20,896 |
Source: Public Records
Map
Nearby Homes
- 49 S Lewis Ave
- 12601 W Atlantic Ave
- 2116 & 2101 Williamsburg Dr
- 24 Washington Terrace
- 2726 W Hidden Glen Dr
- 132 Dorchester Ct
- 0 Brookside Ave
- 1521 Catalpa Ave
- 102 Baldwin Ave
- 1416 Hamilton Ct
- 2115 Lydia St
- 615 Tiffany Dr
- 23 N Jackson St
- 1213 Grand Ave
- 446 S Jackson St
- 3027 Belvidere Rd
- 3170 W Monroe St Unit 309
- 304 Powell Ave
- 819 S Fulton Ave
- 28 N Saint James St
- 2214 Catalpa St
- 51 S Orchard Ave
- 41 S Orchard Ave
- 2210 Catalpa St
- 37 S Orchard Ave
- 2217 Catalpa St
- 2215 Catalpa St
- 105 S Orchard Ave
- 33 S Orchard Ave
- 48 S Gretta Ave
- 2206 Catalpa St
- 2213 Catalpa St
- 44 S Gretta Ave
- 44 S Orchard Ave
- 52 S Orchard Ave
- 40 S Gretta Ave
- 42 S Orchard Ave
- 102 S Orchard Ave
- 2205 Catalpa St
- 38 S Gretta Ave