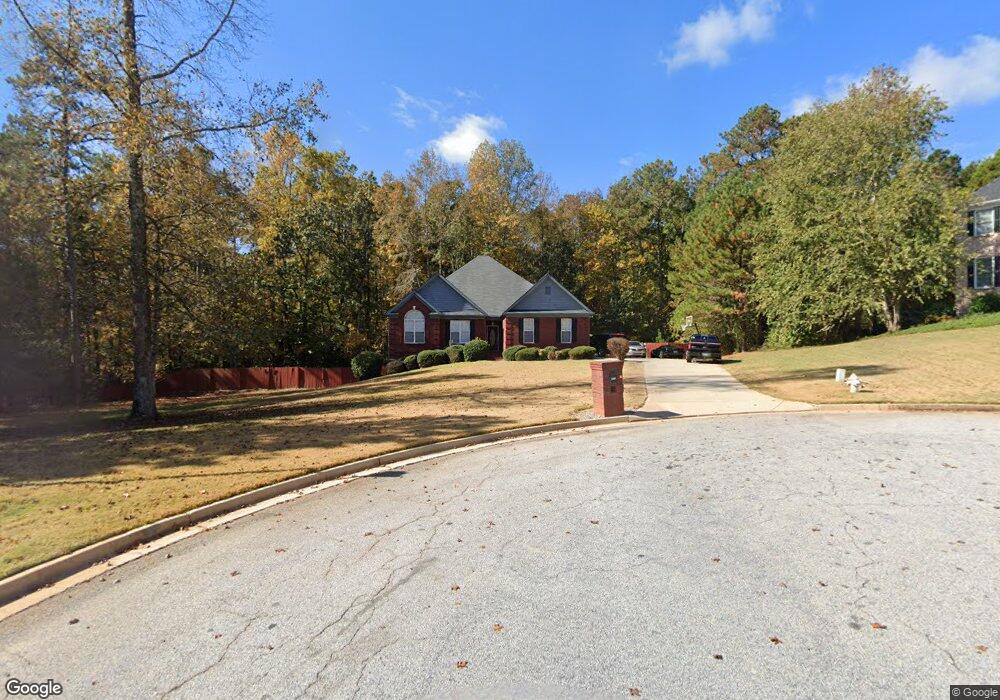
2218 Crescent Walk Unit 9 Conyers, GA 30094
Estimated Value: $421,000 - $724,000
5
Beds
3
Baths
4,782
Sq Ft
$108/Sq Ft
Est. Value
About This Home
This home is located at 2218 Crescent Walk Unit 9, Conyers, GA 30094 and is currently estimated at $516,539, approximately $108 per square foot. 2218 Crescent Walk Unit 9 is a home located in Rockdale County with nearby schools including Lorraine Elementary School, Gen. Ray Davis Middle School, and Salem High School.
Ownership History
Date
Name
Owned For
Owner Type
Purchase Details
Closed on
May 21, 2013
Sold by
Andrews Keith W
Bought by
Collier Jaunita
Current Estimated Value
Home Financials for this Owner
Home Financials are based on the most recent Mortgage that was taken out on this home.
Original Mortgage
$235,942
Outstanding Balance
$165,452
Interest Rate
3.25%
Mortgage Type
FHA
Estimated Equity
$351,087
Purchase Details
Closed on
Mar 19, 2010
Sold by
Federal Home Loan Mortgage Corporation
Bought by
Andrews Keith W and Andrews Cheryl L
Home Financials for this Owner
Home Financials are based on the most recent Mortgage that was taken out on this home.
Original Mortgage
$188,522
Interest Rate
4.73%
Mortgage Type
FHA
Purchase Details
Closed on
Jan 5, 2010
Sold by
Wells Fargo Bk Na
Bought by
Federal Home Loan Mortgage Corporation
Create a Home Valuation Report for This Property
The Home Valuation Report is an in-depth analysis detailing your home's value as well as a comparison with similar homes in the area
Home Values in the Area
Average Home Value in this Area
Purchase History
| Date | Buyer | Sale Price | Title Company |
|---|---|---|---|
| Collier Jaunita | $244,500 | -- | |
| Andrews Keith W | $192,000 | -- | |
| Federal Home Loan Mortgage Corporation | -- | -- | |
| Wells Fargo Bk Na | $167,500 | -- |
Source: Public Records
Mortgage History
| Date | Status | Borrower | Loan Amount |
|---|---|---|---|
| Open | Collier Jaunita | $235,942 | |
| Previous Owner | Andrews Keith W | $188,522 |
Source: Public Records
Tax History Compared to Growth
Tax History
| Year | Tax Paid | Tax Assessment Tax Assessment Total Assessment is a certain percentage of the fair market value that is determined by local assessors to be the total taxable value of land and additions on the property. | Land | Improvement |
|---|---|---|---|---|
| 2024 | $4,410 | $174,480 | $39,800 | $134,680 |
| 2023 | $4,202 | $172,000 | $39,800 | $132,200 |
| 2022 | $3,519 | $145,400 | $35,280 | $110,120 |
| 2021 | $3,374 | $130,960 | $26,920 | $104,040 |
| 2020 | $3,032 | $114,160 | $25,800 | $88,360 |
| 2019 | $2,904 | $107,560 | $19,200 | $88,360 |
| 2018 | $2,787 | $103,200 | $14,840 | $88,360 |
| 2017 | $2,327 | $87,360 | $15,800 | $71,560 |
| 2016 | $2,152 | $87,360 | $15,800 | $71,560 |
| 2015 | $2,086 | $84,920 | $13,360 | $71,560 |
| 2014 | $2,129 | $95,080 | $13,360 | $81,720 |
| 2013 | -- | $113,800 | $30,000 | $83,800 |
Source: Public Records
Map
Nearby Homes
- 2206 Crescent Walk
- 2150 Oglesby Bridge Rd SW
- 2301 Mallory Cir Unit 2
- 2104 Crest Wood Dr
- 6018 Vicksburg Ct
- 1433 Cotton Trail SW
- 1821 Holmes Dr SW
- 0 Bellevue Dr Unit 10483100
- 1840 Holmsey Cir
- 1765 Elizabeth Ct SW
- 1709 Elizabeth Ct SW
- 1769 Elizabeth Ct SW
- 1740 Elizabeth Ct SW
- 1938 Highway 212 SW
- 5162 Kurt Ln SW
- 5262 E Shore Dr SW
- 1721 Windsong Dr SW
- 1590 Colonial South Dr SW
- 4530 Wentworth Place SW
- 2218 Crescent Walk
- 2217 Crescent Walk
- 2704 Arden Terrace SW
- 2214 Crescent Walk
- 2013 Whippoorwill Way
- 2017 Whippoorwill Way Unit 2
- 2213 Crescent Walk
- 2009 Whippoorwill Way Unit 2
- 2708 Arden Terrace SW
- 2021 Whippoorwill Way
- 2005 Whippoorwill Way
- 2210 Crescent Walk
- 2210 Crescent Walk Unit 11
- 2712 Arden Terrace SW
- 2701 Arden Terrace SW
- 2705 Arden Terrace SW
- 0 Arden Terrace SW Unit 7380731
- 0 Arden Terrace SW Unit 3167121
- 0 Arden Terrace SW Unit 7082344
- 0 Arden Terrace SW Unit 3174296