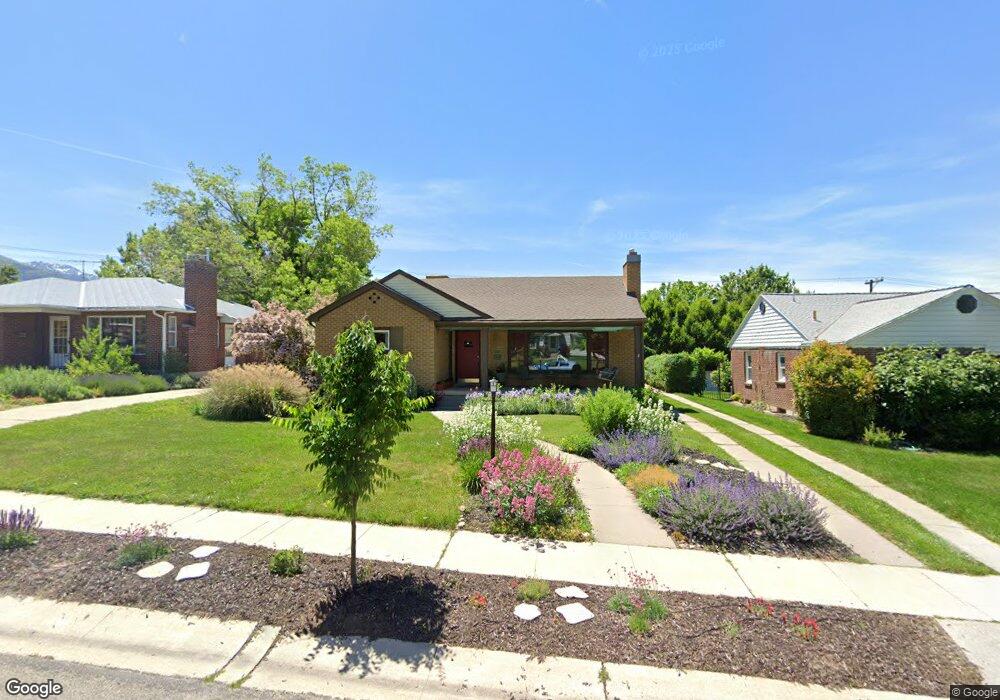
2218 Emerson Ave Salt Lake City, UT 84108
Bonneville Hills NeighborhoodEstimated Value: $785,000 - $871,153
3
Beds
2
Baths
1,228
Sq Ft
$674/Sq Ft
Est. Value
About This Home
This home is located at 2218 Emerson Ave, Salt Lake City, UT 84108 and is currently estimated at $828,038, approximately $674 per square foot. 2218 Emerson Ave is a home located in Salt Lake County with nearby schools including Beacon Heights School, Hillside Middle School, and Highland High School.
Ownership History
Date
Name
Owned For
Owner Type
Purchase Details
Closed on
Nov 11, 2021
Sold by
Rosen Peter and Moss Rosen Holly
Bought by
Rosen Peter Marshall and Moss Rosen Holly
Current Estimated Value
Purchase Details
Closed on
May 4, 2005
Sold by
Adey Nils B and Greig Ann
Bought by
Rosen Peter and Moss Rosen Holly
Home Financials for this Owner
Home Financials are based on the most recent Mortgage that was taken out on this home.
Original Mortgage
$211,900
Outstanding Balance
$111,549
Interest Rate
5.99%
Mortgage Type
Fannie Mae Freddie Mac
Estimated Equity
$716,489
Purchase Details
Closed on
Oct 16, 1995
Sold by
Darby Vera M
Bought by
Adey Nils B and Greig Ann
Home Financials for this Owner
Home Financials are based on the most recent Mortgage that was taken out on this home.
Original Mortgage
$79,000
Interest Rate
7.8%
Purchase Details
Closed on
Oct 12, 1995
Sold by
First Interstate Bank Of Utah N A
Bought by
Darby Vera M
Home Financials for this Owner
Home Financials are based on the most recent Mortgage that was taken out on this home.
Original Mortgage
$79,000
Interest Rate
7.8%
Create a Home Valuation Report for This Property
The Home Valuation Report is an in-depth analysis detailing your home's value as well as a comparison with similar homes in the area
Home Values in the Area
Average Home Value in this Area
Purchase History
| Date | Buyer | Sale Price | Title Company |
|---|---|---|---|
| Rosen Peter Marshall | -- | None Available | |
| Rosen Peter | -- | Guardian Title | |
| Adey Nils B | -- | Paramount Title Corp | |
| Darby Vera M | -- | -- |
Source: Public Records
Mortgage History
| Date | Status | Borrower | Loan Amount |
|---|---|---|---|
| Open | Rosen Peter | $211,900 | |
| Previous Owner | Adey Nils B | $79,000 |
Source: Public Records
Tax History Compared to Growth
Tax History
| Year | Tax Paid | Tax Assessment Tax Assessment Total Assessment is a certain percentage of the fair market value that is determined by local assessors to be the total taxable value of land and additions on the property. | Land | Improvement |
|---|---|---|---|---|
| 2025 | $3,733 | $751,500 | $199,500 | $552,000 |
| 2024 | $3,733 | $712,200 | $190,400 | $521,800 |
| 2023 | $3,711 | $682,500 | $183,100 | $499,400 |
| 2022 | $4,068 | $702,000 | $179,400 | $522,600 |
| 2021 | $3,572 | $558,100 | $145,600 | $412,500 |
| 2020 | $3,100 | $461,000 | $133,800 | $327,200 |
| 2019 | $2,861 | $400,200 | $118,100 | $282,100 |
| 2018 | $2,672 | $364,000 | $118,100 | $245,900 |
| 2017 | $2,747 | $350,600 | $118,100 | $232,500 |
| 2016 | $2,757 | $334,200 | $118,100 | $216,100 |
| 2015 | $2,497 | $286,900 | $115,700 | $171,200 |
| 2014 | $2,431 | $277,100 | $115,700 | $161,400 |
Source: Public Records
Map
Nearby Homes
- 2266 E Kensington Ave
- 1444 Beacon Dr
- 2366 Logan Ave S
- 2125 Logan Ave S
- 1502 S 2400 E
- 2270 E 1700 S
- 2326 E 1700 S
- 1182 S Foothill Dr Unit 511
- 1962 E Janet Kay Ln S
- 1170 S Foothill Dr Unit 311
- 1970 E Tartan Ave
- 1970 Logan Ave S
- 2138 E Wilson Ave
- 1540 Preston St
- 2008 E Laird Dr
- 1583 S 1900 E
- 2536 E Kensington Ave
- 1929 Laird Dr
- 1980 Downington Ave S
- 1769 S Foothill Dr
- 2212 Emerson Ave
- 2226 E Emerson Ave
- 2226 Emerson Ave
- 2204 E Emerson Ave
- 2204 Emerson Ave
- 2234 E Emerson Ave
- 2234 Emerson Ave
- 2223 Kensington Ave
- 2215 Kensington Ave
- 2227 Kensington Ave
- 2205 Kensington Ave
- 2217 Emerson Ave
- 2242 Emerson Ave
- 2242 E Emerson Ave
- 2213 E Emerson Ave
- 2225 Emerson Ave
- 2213 Emerson Ave
- 2205 Emerson Ave
- 2233 E Emerson Ave
- 2205 E Emerson Ave