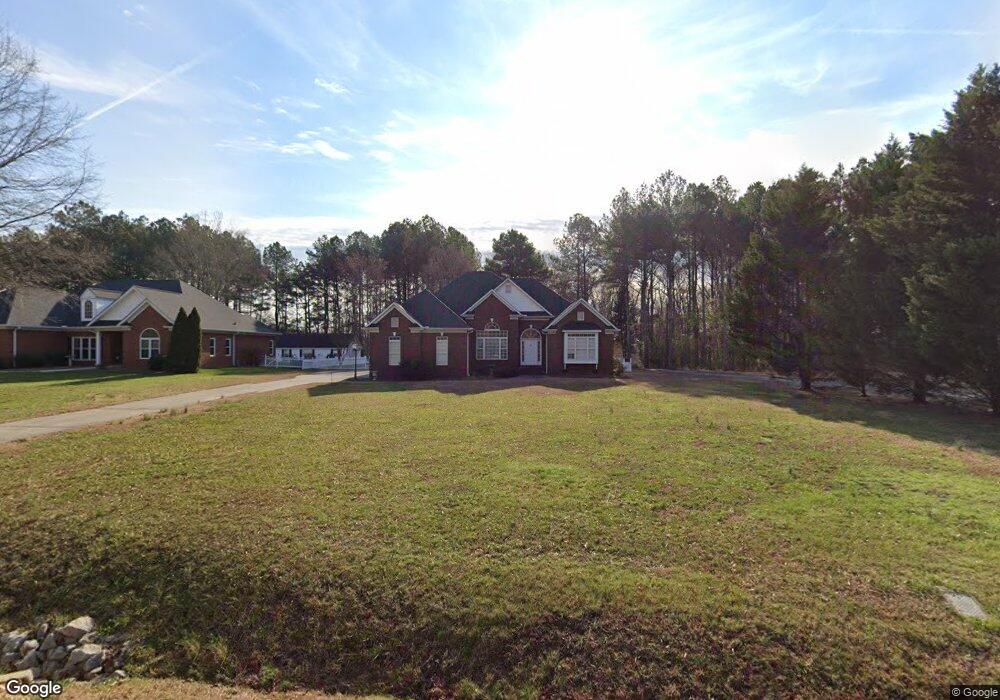
2218 Fowler Secrest Rd Monroe, NC 28110
Estimated Value: $472,000 - $506,000
4
Beds
2
Baths
1,990
Sq Ft
$246/Sq Ft
Est. Value
About This Home
This home is located at 2218 Fowler Secrest Rd, Monroe, NC 28110 and is currently estimated at $489,551, approximately $246 per square foot. 2218 Fowler Secrest Rd is a home located in Union County with nearby schools including Porter Ridge Elementary School, Piedmont Middle School, and Piedmont High School.
Ownership History
Date
Name
Owned For
Owner Type
Purchase Details
Closed on
Jan 1, 2024
Sold by
Massa Christina L
Bought by
Brakefield James and Brakefield Cheryl
Current Estimated Value
Purchase Details
Closed on
Feb 20, 2009
Sold by
Young Jean D and Young Arnold Ray
Bought by
Massa Joseph H and Massa Christina L
Purchase Details
Closed on
Jul 31, 2000
Sold by
Mcclain Donald W and Mcclain Carrie J
Bought by
Young Arnold Ray and Young Jean D
Home Financials for this Owner
Home Financials are based on the most recent Mortgage that was taken out on this home.
Original Mortgage
$182,500
Interest Rate
8.23%
Purchase Details
Closed on
Jun 29, 1999
Sold by
Spurlock Homes Inc
Bought by
Mcclain Donald W and Mcclain Carrie J
Home Financials for this Owner
Home Financials are based on the most recent Mortgage that was taken out on this home.
Original Mortgage
$153,600
Interest Rate
7.27%
Create a Home Valuation Report for This Property
The Home Valuation Report is an in-depth analysis detailing your home's value as well as a comparison with similar homes in the area
Purchase History
| Date | Buyer | Sale Price | Title Company |
|---|---|---|---|
| Brakefield James | -- | None Listed On Document | |
| Massa Joseph H | $215,000 | None Available | |
| Young Arnold Ray | $205,000 | -- | |
| Mcclain Donald W | $32,000 | -- |
Source: Public Records
Mortgage History
| Date | Status | Borrower | Loan Amount |
|---|---|---|---|
| Previous Owner | Young Arnold Ray | $182,500 | |
| Previous Owner | Mcclain Donald W | $153,600 |
Source: Public Records
Tax History
| Year | Tax Paid | Tax Assessment Tax Assessment Total Assessment is a certain percentage of the fair market value that is determined by local assessors to be the total taxable value of land and additions on the property. | Land | Improvement |
|---|---|---|---|---|
| 2025 | $4,317 | $493,800 | $0 | $0 |
| 2024 | $3,504 | $321,300 | $52,000 | $269,300 |
| 2023 | $3,504 | $321,300 | $52,000 | $269,300 |
| 2022 | $3,504 | $321,300 | $52,000 | $269,300 |
| 2021 | $3,504 | $321,300 | $52,000 | $269,300 |
| 2020 | $3,187 | $236,600 | $53,000 | $183,600 |
| 2019 | $3,187 | $236,600 | $53,000 | $183,600 |
| 2018 | $1,458 | $236,600 | $53,000 | $183,600 |
| 2017 | $3,235 | $236,600 | $53,000 | $183,600 |
| 2016 | $3,201 | $236,600 | $53,000 | $183,600 |
| 2015 | $1,837 | $236,600 | $53,000 | $183,600 |
| 2014 | $2,493 | $211,320 | $45,000 | $166,320 |
Source: Public Records
Map
Nearby Homes
- 3207 Valleydale Rd
- 3214 Woodlands Creek Dr
- 2504 Countryside Ln Unit B
- 1914 John Moore Rd
- 2604 Logan Caroline Ln
- 2526 Mabel Ln
- 2532 Mabel Ln
- 2550 Mabel Ln
- Henderson Plan at Blair Place
- Appalachian Plan at Blair Place
- Prescott Plan at Blair Place
- 2608 Mabel Ln
- 2513 Mabel Ln
- Lassen Plan at Blair Place
- Eldorado Plan at Blair Place
- 3016 Woodlands Creek Dr
- 2616 Mabel Ln
- 2613 Mabel Ln
- 2521 Mabel Ln
- 2529 Mabel Ln
- 2222 Fowler Secrest Rd
- 2226 Fowler Secrest Rd
- 2216 Fowler Secrest Rd
- 2213 Fowler Secrest Rd
- 2300 Fowler Secrest Rd
- 2205 Fowler Secrest Rd
- 3207 Secrest Price Rd
- 2223 Fox Hunt Dr
- 2221 Fox Hunt Dr
- 2304 Fowler Secrest Rd
- 2225 Fox Hunt Dr
- 2303 Fowler Secrest Rd
- 3211 Secrest Price Rd
- 2036 Bonanza Rd
- 2229 Fox Hunt Dr
- 2217 Fox Hunt Dr
- 2307 Fowler Secrest Rd
- 2308 Fowler Secrest Rd
- 2115 Fowler Secrest Rd
- 2105 Bovender Rd