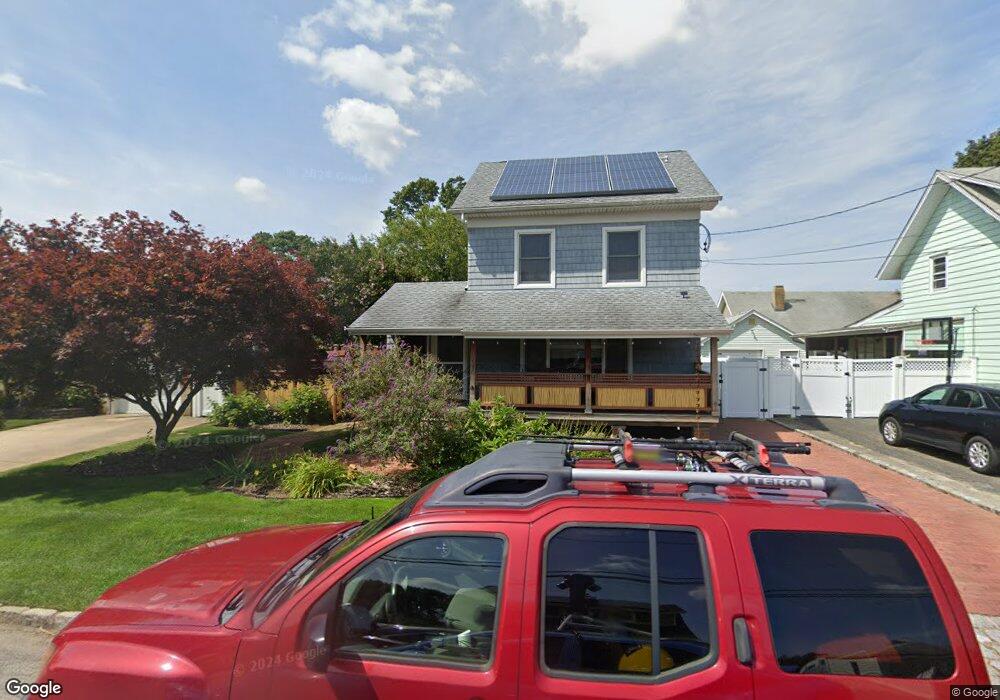
2218 Hortense Ave Seaford, NY 11783
Estimated Value: $658,471 - $716,000
2
Beds
2
Baths
1,176
Sq Ft
$584/Sq Ft
Est. Value
About This Home
This home is located at 2218 Hortense Ave, Seaford, NY 11783 and is currently estimated at $687,236, approximately $584 per square foot. 2218 Hortense Ave is a home located in Nassau County with nearby schools including Seaford Middle School, Seaford Senior High School, and St. William the Abbot School.
Ownership History
Date
Name
Owned For
Owner Type
Purchase Details
Closed on
Jan 31, 2024
Sold by
Anzalaou Joseph Benjamin
Bought by
Anzalone Joseph Benjamin and Anzalone Marines Lee
Current Estimated Value
Purchase Details
Closed on
Aug 30, 2021
Sold by
Kowalski Colin and Kowalski Maria
Bought by
Anzalone Joseph Benjamin
Purchase Details
Closed on
Jul 5, 2001
Purchase Details
Closed on
May 31, 2000
Sold by
Leifer Leung A
Bought by
Iacopelli Maria
Purchase Details
Closed on
Jan 28, 1998
Purchase Details
Closed on
Dec 23, 1997
Sold by
Oslecki Norbert
Bought by
Leifer Jenny A
Purchase Details
Closed on
Mar 16, 1996
Sold by
Vonthaden George and Vonthaden Barbara
Bought by
Osiecki Norbert and Osiecki Gerda
Create a Home Valuation Report for This Property
The Home Valuation Report is an in-depth analysis detailing your home's value as well as a comparison with similar homes in the area
Home Values in the Area
Average Home Value in this Area
Purchase History
| Date | Buyer | Sale Price | Title Company |
|---|---|---|---|
| Anzalone Joseph Benjamin | -- | First American Title Ins Co | |
| Anzalone Joseph Benjamin | -- | First American Title Ins Co | |
| Anzalone Joseph Benjamin | $550,000 | Old Republic Title | |
| Anzalone Joseph Benjamin | $550,000 | Old Republic Title | |
| Anzalone Joseph Benjamin | $550,000 | Old Republic Title | |
| -- | -- | -- | |
| -- | -- | -- | |
| Iacopelli Maria | $184,000 | Edwin Molloy | |
| Iacopelli Maria | $184,000 | Edwin Molloy | |
| -- | -- | -- | |
| -- | -- | -- | |
| Leifer Jenny A | $155,000 | -- | |
| Leifer Jenny A | $155,000 | -- | |
| Osiecki Norbert | -- | -- | |
| Osiecki Norbert | -- | -- |
Source: Public Records
Tax History Compared to Growth
Tax History
| Year | Tax Paid | Tax Assessment Tax Assessment Total Assessment is a certain percentage of the fair market value that is determined by local assessors to be the total taxable value of land and additions on the property. | Land | Improvement |
|---|---|---|---|---|
| 2025 | $13,112 | $448 | $228 | $220 |
| 2024 | $3,210 | $440 | $224 | $216 |
| 2023 | $11,683 | $448 | $228 | $220 |
| 2022 | $11,683 | $444 | $198 | $246 |
| 2021 | $13,658 | $435 | $194 | $241 |
| 2020 | $8,315 | $530 | $529 | $1 |
| 2019 | $2,796 | $568 | $534 | $34 |
| 2018 | $5,642 | $606 | $0 | $0 |
| 2017 | $6,489 | $707 | $570 | $137 |
| 2016 | $9,703 | $707 | $570 | $137 |
| 2015 | $2,984 | $707 | $570 | $137 |
| 2014 | $2,984 | $707 | $570 | $137 |
| 2013 | $2,799 | $707 | $570 | $137 |
Source: Public Records
Map
Nearby Homes
- 3937 John Ln
- 2349 S Seamans Neck Rd
- 2327 Mattituck Ave
- 3945 Hickory St
- 243 Seaford Ave
- 3875 South St
- 3969 Marlow Ct
- 2067 Jackson Ave
- 10 Garfield Place
- 2370 Narraganset Ave
- 2437 Archer St
- 3861 Wilburne Ave
- 230 W End Ave
- 344 Harrison Ave
- 138 Saint Marks Place
- 3663 Roanoke St
- 28 Grove St
- 65 Jefferson Place
- 3608 Tonopah St
- 3 Roxbury Ln
- 2220 Hortense Ave
- 2214 Hortense Ave
- 2230 Hortense Ave
- 2208 Hortense Ave
- 2215 Jackson Ave
- 2221 Jackson Ave
- 2221 Hortense Ave
- 2225 Hortense Ave
- 3950 Helen St
- 2202 Hortense Ave
- 2229 Hortense Ave
- 2194 Hortense Ave
- 2197 Hortense Ave
- 3951 Helen St
- 2188 Hortense Ave
- 2220 Washington Ave
- 2222 Washington Ave
- 2230 Washington Ave
- 2245 Jackson Ave
- 2230 Jackson Ave