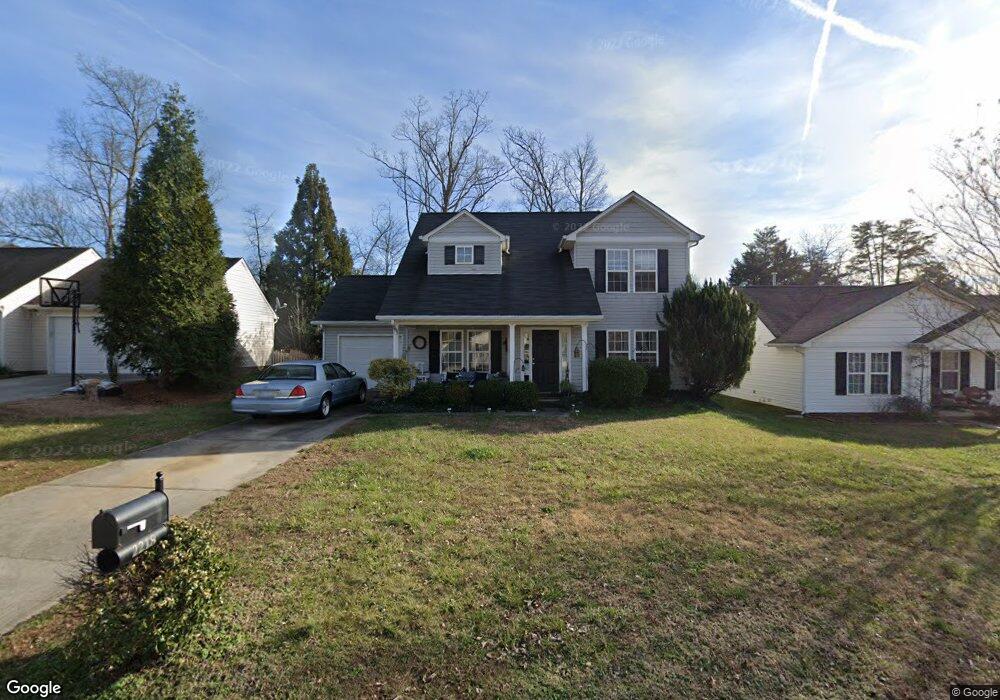
2218 Oakhurst Ct Kannapolis, NC 28081
Estimated Value: $283,000 - $314,000
3
Beds
3
Baths
1,450
Sq Ft
$209/Sq Ft
Est. Value
About This Home
This home is located at 2218 Oakhurst Ct, Kannapolis, NC 28081 and is currently estimated at $302,665, approximately $208 per square foot. 2218 Oakhurst Ct is a home located in Cabarrus County with nearby schools including Winecoff Elementary School, Northwest Cabarrus Middle School, and Northwest Cabarrus High.
Ownership History
Date
Name
Owned For
Owner Type
Purchase Details
Closed on
Jul 29, 2008
Sold by
Long Julie Ann Brown and Long Jessie Ray
Bought by
Brown J Michael and Brown Rhonda Y
Current Estimated Value
Home Financials for this Owner
Home Financials are based on the most recent Mortgage that was taken out on this home.
Original Mortgage
$91,000
Interest Rate
5.99%
Mortgage Type
Purchase Money Mortgage
Purchase Details
Closed on
Sep 18, 2006
Sold by
Hud
Bought by
Brown Julie A
Home Financials for this Owner
Home Financials are based on the most recent Mortgage that was taken out on this home.
Original Mortgage
$123,000
Interest Rate
6.14%
Mortgage Type
Purchase Money Mortgage
Purchase Details
Closed on
May 10, 2006
Sold by
Hatley Holly H
Bought by
Hud
Purchase Details
Closed on
Jan 31, 2003
Sold by
Randall Homes Inc
Bought by
Hatley Holly H
Home Financials for this Owner
Home Financials are based on the most recent Mortgage that was taken out on this home.
Original Mortgage
$129,412
Interest Rate
5.98%
Mortgage Type
FHA
Purchase Details
Closed on
Jan 11, 2002
Sold by
Bost Danny G
Bought by
Randall Homes Inc
Create a Home Valuation Report for This Property
The Home Valuation Report is an in-depth analysis detailing your home's value as well as a comparison with similar homes in the area
Home Values in the Area
Average Home Value in this Area
Purchase History
| Date | Buyer | Sale Price | Title Company |
|---|---|---|---|
| Brown J Michael | $121,000 | None Available | |
| Brown Julie A | -- | None Available | |
| Hud | $133,702 | None Available | |
| Hatley Holly H | $131,500 | -- | |
| Randall Homes Inc | $26,500 | -- |
Source: Public Records
Mortgage History
| Date | Status | Borrower | Loan Amount |
|---|---|---|---|
| Closed | Brown J Michael | $91,000 | |
| Previous Owner | Brown Julie A | $123,000 | |
| Previous Owner | Hatley Holly H | $129,412 |
Source: Public Records
Tax History
| Year | Tax Paid | Tax Assessment Tax Assessment Total Assessment is a certain percentage of the fair market value that is determined by local assessors to be the total taxable value of land and additions on the property. | Land | Improvement |
|---|---|---|---|---|
| 2025 | $3,282 | $289,020 | $65,000 | $224,020 |
| 2024 | $3,282 | $289,020 | $65,000 | $224,020 |
| 2023 | $2,376 | $173,450 | $45,000 | $128,450 |
| 2022 | $2,376 | $173,450 | $45,000 | $128,450 |
| 2021 | $2,376 | $173,450 | $45,000 | $128,450 |
| 2020 | $2,376 | $173,450 | $45,000 | $128,450 |
| 2019 | $1,730 | $126,300 | $22,000 | $104,300 |
| 2018 | $1,705 | $126,300 | $22,000 | $104,300 |
| 2017 | $1,680 | $126,300 | $22,000 | $104,300 |
| 2016 | $1,680 | $118,310 | $22,000 | $96,310 |
| 2015 | $1,473 | $118,310 | $22,000 | $96,310 |
| 2014 | $1,473 | $118,310 | $22,000 | $96,310 |
Source: Public Records
Map
Nearby Homes
- 2203 Oakhurst Ct
- 121 Greenview Dr
- 128 Greenview Dr
- 366 Courtland Ct
- 119 Carriage House Dr
- 103 Carriage House Dr
- 2116 S Main St
- 251 Briarcliff Dr
- 301 Briarcliff Dr
- 2305 Bloomfield Dr
- 112 Elwood St
- 2342 Bloomfield Dr
- 626 Flicker St
- 634 Peacehaven Rd
- 2448 Spruce St
- 2475 Hedgecliff Rd
- 302 Suburban Ave
- 2485 Hedgecliff Rd
- 2515 Hedgecliff Rd
- 2525 Hedgecliff Rd
- 2214 Oakhurst Ct
- 2222 Oakhurst Ct
- 2210 Oakhurst Ct
- 168 Ashmont Dr
- 2226 Oakhurst Ct
- 162 Ashmont Dr
- 172 Ashmont Dr
- 156 Ashmont Dr
- 176 Ashmont Dr
- 176 Ashmont Dr Unit 102
- 2219 Oakhurst Ct
- 148 Ashmont Dr
- 2223 Oakhurst Ct
- 2215 Oakhurst Ct
- 180 Ashmont Dr
- 2206 Oakhurst Ct
- 2227 Oakhurst Ct
- 2236 Oakhurst Ct
- 2213 Oakhurst Ct
- 2231 Oakhurst Ct
Your Personal Tour Guide
Ask me questions while you tour the home.