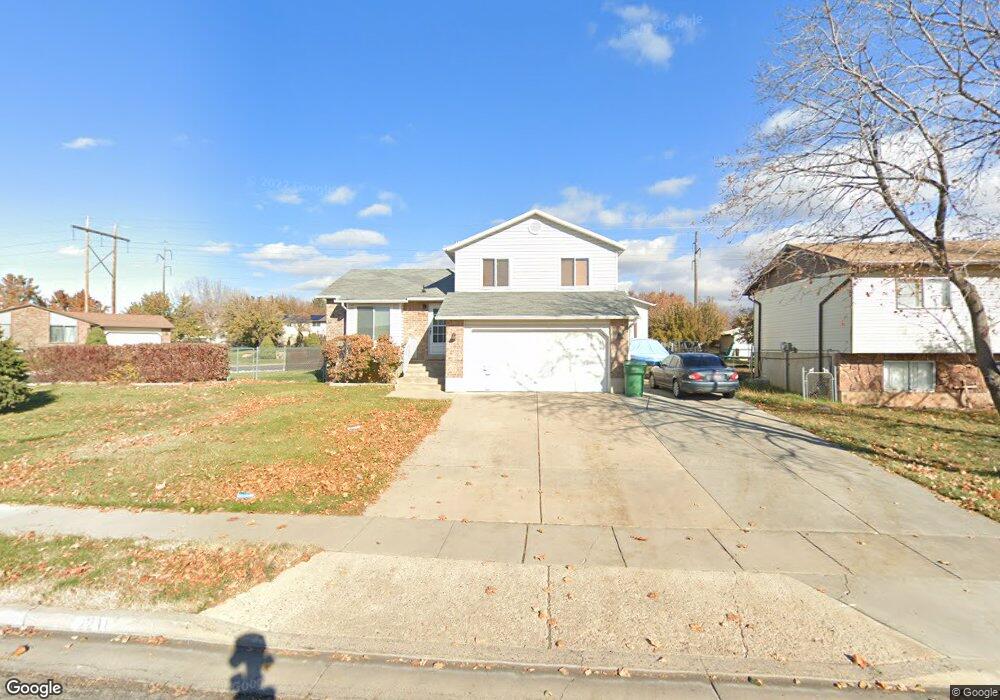
2218 S 150 W Clearfield, UT 84015
Estimated Value: $430,000 - $477,000
5
Beds
3
Baths
1,880
Sq Ft
$241/Sq Ft
Est. Value
About This Home
This home is located at 2218 S 150 W, Clearfield, UT 84015 and is currently estimated at $452,574, approximately $240 per square foot. 2218 S 150 W is a home located in Davis County with nearby schools including Antelope Elementary School, North Davis Junior High School, and Clearfield High School.
Ownership History
Date
Name
Owned For
Owner Type
Purchase Details
Closed on
Jul 30, 2013
Sold by
Sandoval Gloria
Bought by
Sandoval Gloria and Sandoval Alejandro
Current Estimated Value
Purchase Details
Closed on
Apr 29, 2013
Sold by
Baxter James A and Baxter Kelene
Bought by
Sandoval Gloria
Home Financials for this Owner
Home Financials are based on the most recent Mortgage that was taken out on this home.
Original Mortgage
$162,011
Outstanding Balance
$114,513
Interest Rate
3.5%
Mortgage Type
FHA
Estimated Equity
$338,061
Purchase Details
Closed on
Jul 29, 1996
Sold by
Breitweiser Gary L and Breitweiser Natalie K
Bought by
Baxter James A and Baxter Kelene
Home Financials for this Owner
Home Financials are based on the most recent Mortgage that was taken out on this home.
Original Mortgage
$70,000
Interest Rate
8.39%
Create a Home Valuation Report for This Property
The Home Valuation Report is an in-depth analysis detailing your home's value as well as a comparison with similar homes in the area
Home Values in the Area
Average Home Value in this Area
Purchase History
| Date | Buyer | Sale Price | Title Company |
|---|---|---|---|
| Sandoval Gloria | -- | Inwest Title Services | |
| Sandoval Gloria | -- | None Available | |
| Baxter James A | -- | Associated Title Company |
Source: Public Records
Mortgage History
| Date | Status | Borrower | Loan Amount |
|---|---|---|---|
| Open | Sandoval Gloria | $162,011 | |
| Previous Owner | Baxter James A | $70,000 |
Source: Public Records
Tax History Compared to Growth
Tax History
| Year | Tax Paid | Tax Assessment Tax Assessment Total Assessment is a certain percentage of the fair market value that is determined by local assessors to be the total taxable value of land and additions on the property. | Land | Improvement |
|---|---|---|---|---|
| 2025 | $2,707 | $242,550 | $65,296 | $177,254 |
| 2024 | $2,626 | $237,049 | $62,372 | $174,677 |
| 2023 | $2,396 | $218,350 | $54,500 | $163,849 |
| 2022 | $2,590 | $422,000 | $101,927 | $320,073 |
| 2021 | $2,245 | $304,000 | $63,322 | $240,678 |
| 2020 | $1,956 | $263,000 | $53,967 | $209,033 |
| 2019 | $1,868 | $248,000 | $53,964 | $194,036 |
| 2018 | $1,647 | $213,000 | $47,899 | $165,101 |
| 2016 | $1,469 | $99,330 | $22,801 | $76,529 |
| 2015 | $1,337 | $86,185 | $22,801 | $63,384 |
| 2014 | $1,334 | $87,146 | $22,801 | $64,345 |
| 2013 | -- | $78,111 | $28,882 | $49,229 |
Source: Public Records
Map
Nearby Homes