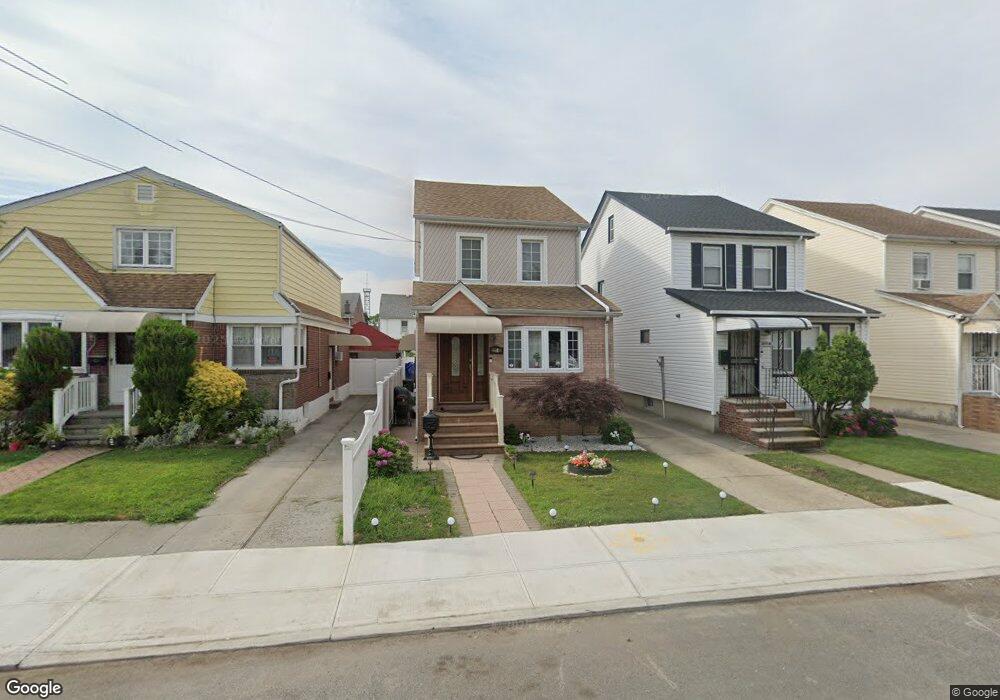
22182 91st Ave Queens Village, NY 11428
Queens Village NeighborhoodEstimated Value: $686,000 - $806,316
--
Bed
--
Bath
1,568
Sq Ft
$484/Sq Ft
Est. Value
About This Home
This home is located at 22182 91st Ave, Queens Village, NY 11428 and is currently estimated at $758,829, approximately $483 per square foot. 22182 91st Ave is a home located in Queens County with nearby schools including P.S. 33 Edward M. Funk, Jean Nuzzi Intermediate School, and Martin Van Buren High School.
Ownership History
Date
Name
Owned For
Owner Type
Purchase Details
Closed on
Mar 14, 2025
Sold by
Persaud Pooran
Bought by
Persaud Brian and Persaud Pooran
Current Estimated Value
Purchase Details
Closed on
Jun 4, 2021
Sold by
Escalante Jessica S and Estate Of Primo E Escalante
Bought by
Persaud Pooran and Persaud Reeai
Home Financials for this Owner
Home Financials are based on the most recent Mortgage that was taken out on this home.
Original Mortgage
$645,050
Outstanding Balance
$584,012
Interest Rate
2.9%
Mortgage Type
Purchase Money Mortgage
Estimated Equity
$174,817
Purchase Details
Closed on
May 20, 2004
Sold by
Whitney Mary P and Whitney Rose A
Bought by
Escalante Primo E
Home Financials for this Owner
Home Financials are based on the most recent Mortgage that was taken out on this home.
Original Mortgage
$292,500
Interest Rate
5.94%
Mortgage Type
Purchase Money Mortgage
Create a Home Valuation Report for This Property
The Home Valuation Report is an in-depth analysis detailing your home's value as well as a comparison with similar homes in the area
Home Values in the Area
Average Home Value in this Area
Purchase History
| Date | Buyer | Sale Price | Title Company |
|---|---|---|---|
| Persaud Brian | -- | -- | |
| Persaud Pooran | $679,000 | -- | |
| Escalante Primo E | $325,000 | -- | |
| Escalante Primo E | $325,000 | -- |
Source: Public Records
Mortgage History
| Date | Status | Borrower | Loan Amount |
|---|---|---|---|
| Open | Persaud Pooran | $645,050 | |
| Previous Owner | Escalante Primo E | $292,500 |
Source: Public Records
Tax History Compared to Growth
Tax History
| Year | Tax Paid | Tax Assessment Tax Assessment Total Assessment is a certain percentage of the fair market value that is determined by local assessors to be the total taxable value of land and additions on the property. | Land | Improvement |
|---|---|---|---|---|
| 2025 | $6,015 | $31,744 | $9,189 | $22,555 |
| 2024 | $5,441 | $29,947 | $10,089 | $19,858 |
| 2023 | $5,675 | $28,253 | $8,343 | $19,910 |
| 2022 | $5,640 | $39,960 | $13,200 | $26,760 |
| 2021 | $5,881 | $39,480 | $13,200 | $26,280 |
| 2020 | $5,599 | $35,700 | $13,200 | $22,500 |
| 2019 | $5,221 | $35,880 | $13,200 | $22,680 |
| 2018 | $4,799 | $23,544 | $9,557 | $13,987 |
| 2017 | $4,799 | $23,544 | $10,136 | $13,408 |
| 2016 | $4,655 | $23,544 | $10,136 | $13,408 |
| 2015 | $2,772 | $22,044 | $12,224 | $9,820 |
| 2014 | $2,772 | $20,797 | $13,827 | $6,970 |
Source: Public Records
Map
Nearby Homes
- 22258 Braddock Ave
- 22289 Braddock Ave Unit 1G
- 222-89 Braddock Ave Unit 6-D
- 222-89 Braddock Ave Unit 5A
- 222-89 Braddock Ave Unit 2-E
- 222-89 Braddock Ave Unit 4B
- 8948 Pontiac St
- 221-18 91st Rd
- 88-29 Winchester Blvd
- 221-15 92nd Ave
- 8922 Moline St
- 22018 91st Rd
- 22167 Braddock Ave
- 9129 220th St
- 233-16 87th Ave
- 91-39 Springfield Blvd
- 227-16 88th Ave Unit Lower
- 231-22 87th Ave
- 221-31 Braddock Ave Unit UPPER
- 221-29 Braddock Ave Unit 1, Building 33
- 221-82 91st Ave
- 22180 91st Ave
- 22186 91st Ave
- 22176 91st Ave
- 22174 91st Ave
- 22179 91st Rd
- 22175 91st Rd
- 9106 222nd St
- 22181 91st Rd
- 22172 91st Ave
- 9102 222nd St
- 22173 91st Rd
- 221-75 91st Rd
- 221-75 91st Rd Unit TWNH
- 9110 222nd St
- 22171 91st Rd
- 22168 91st Ave
- 9114 222nd St
- 22167 91st Rd
- 22181 91st Ave