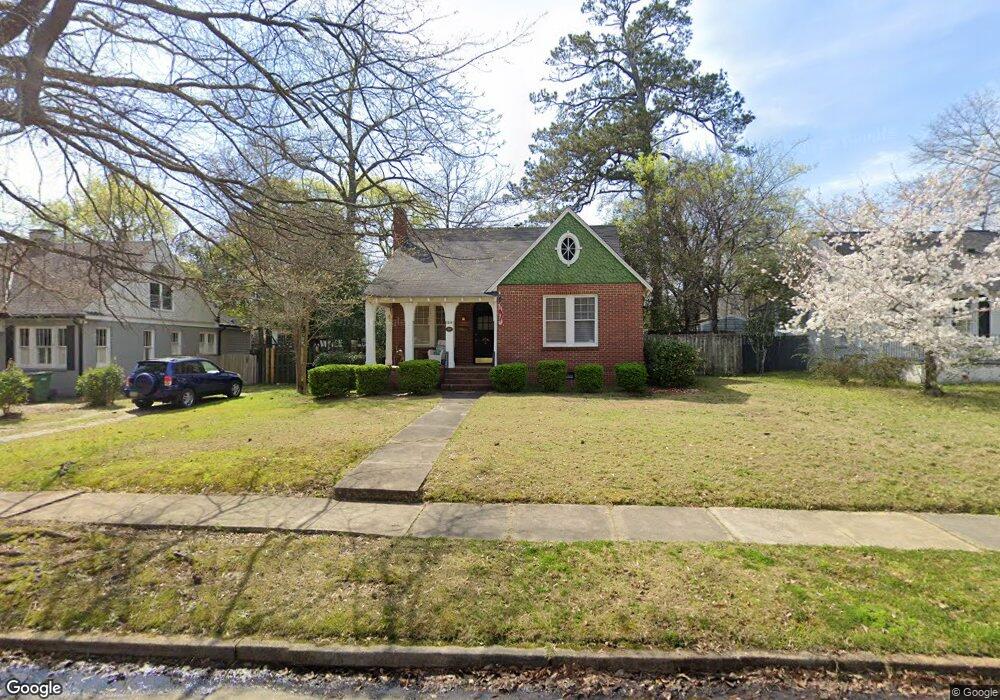
2219 19th Ave Columbus, GA 31901
Saint Elmo Weracoba NeighborhoodEstimated Value: $173,000 - $187,984
3
Beds
2
Baths
1,472
Sq Ft
$122/Sq Ft
Est. Value
About This Home
This home is located at 2219 19th Ave, Columbus, GA 31901 and is currently estimated at $179,746, approximately $122 per square foot. 2219 19th Ave is a home located in Muscogee County with nearby schools including Richards Middle School, Jordan Vocational High School, and Wynnton Elementary School.
Ownership History
Date
Name
Owned For
Owner Type
Purchase Details
Closed on
Mar 13, 2024
Sold by
Broda Kenneth J
Bought by
Angell Carol and Weaver Michael
Current Estimated Value
Purchase Details
Closed on
Nov 8, 2023
Sold by
Broda Tiffany
Bought by
Broda Kenneth J
Purchase Details
Closed on
Aug 6, 2014
Sold by
Holzknecht Theresa L
Bought by
Broda Kenneth J and Broda Tiffany Osborne
Purchase Details
Closed on
May 5, 2011
Sold by
Steers James W
Bought by
Holzknecht Theresa L
Create a Home Valuation Report for This Property
The Home Valuation Report is an in-depth analysis detailing your home's value as well as a comparison with similar homes in the area
Home Values in the Area
Average Home Value in this Area
Purchase History
| Date | Buyer | Sale Price | Title Company |
|---|---|---|---|
| Angell Carol | $167,300 | None Listed On Document | |
| Angell Carol | $167,300 | None Listed On Document | |
| Broda Kenneth J | -- | None Listed On Document | |
| Broda Kenneth J | $68,000 | -- | |
| Holzknecht Theresa L | -- | -- |
Source: Public Records
Tax History Compared to Growth
Tax History
| Year | Tax Paid | Tax Assessment Tax Assessment Total Assessment is a certain percentage of the fair market value that is determined by local assessors to be the total taxable value of land and additions on the property. | Land | Improvement |
|---|---|---|---|---|
| 2025 | $2,307 | $58,936 | $9,960 | $48,976 |
| 2024 | $2,307 | $58,936 | $9,960 | $48,976 |
| 2023 | $2,322 | $58,936 | $9,960 | $48,976 |
| 2022 | $1,900 | $46,536 | $9,960 | $36,576 |
| 2021 | $1,856 | $45,456 | $9,960 | $35,496 |
| 2020 | $1,856 | $45,456 | $9,960 | $35,496 |
| 2019 | $1,862 | $45,456 | $9,960 | $35,496 |
| 2018 | $1,862 | $45,456 | $9,960 | $35,496 |
| 2017 | $1,868 | $45,456 | $9,960 | $35,496 |
| 2016 | $1,803 | $43,713 | $8,467 | $35,246 |
| 2015 | $449 | $27,200 | $8,467 | $18,733 |
| 2014 | $781 | $47,214 | $8,467 | $38,747 |
| 2013 | -- | $47,214 | $8,467 | $38,747 |
Source: Public Records
Map
Nearby Homes