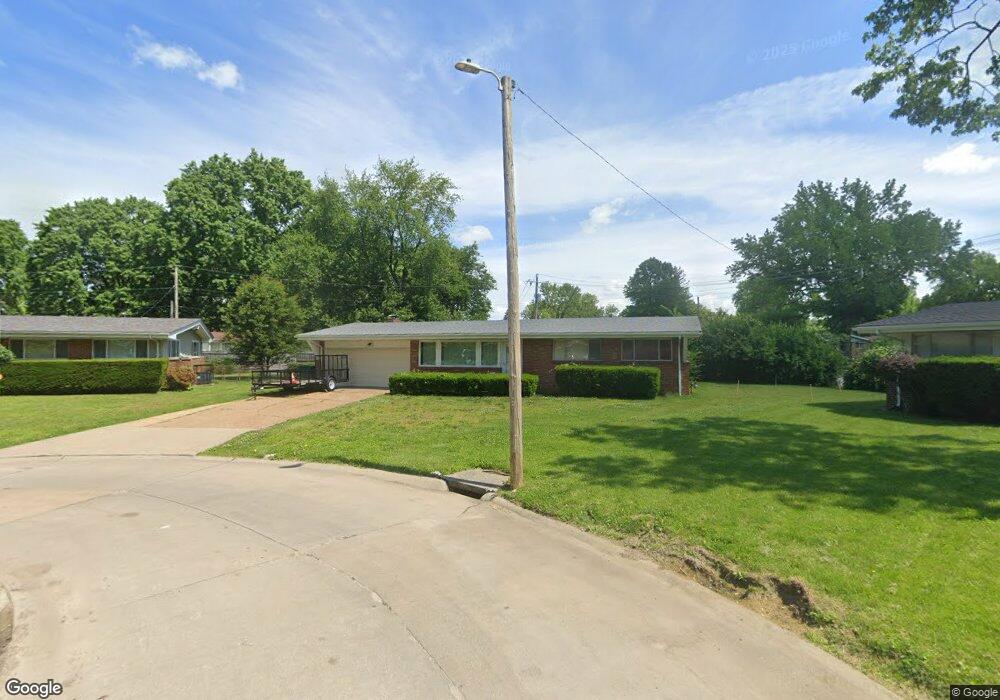
2219 Foss Ct Saint Louis, MO 63136
Hathaway Manor NeighborhoodEstimated Value: $128,000 - $146,000
4
Beds
2
Baths
1,420
Sq Ft
$99/Sq Ft
Est. Value
About This Home
This home is located at 2219 Foss Ct, Saint Louis, MO 63136 and is currently estimated at $140,541, approximately $98 per square foot. 2219 Foss Ct is a home located in St. Louis County with nearby schools including Riverview Gardens Senior High School, Dwight McDaniels School of Christian Education, and St. Louis Unified School.
Ownership History
Date
Name
Owned For
Owner Type
Purchase Details
Closed on
May 28, 2021
Sold by
Cade Beverly C and Cade Richard S
Bought by
Cade Beverly C and Cade Richard S
Current Estimated Value
Home Financials for this Owner
Home Financials are based on the most recent Mortgage that was taken out on this home.
Original Mortgage
$71,250
Outstanding Balance
$53,019
Interest Rate
2.2%
Mortgage Type
New Conventional
Estimated Equity
$87,522
Purchase Details
Closed on
Mar 5, 1998
Sold by
Vasser Beverly C and Vasser Beverly C
Bought by
Spight Beverly C
Home Financials for this Owner
Home Financials are based on the most recent Mortgage that was taken out on this home.
Original Mortgage
$66,000
Interest Rate
7.13%
Create a Home Valuation Report for This Property
The Home Valuation Report is an in-depth analysis detailing your home's value as well as a comparison with similar homes in the area
Home Values in the Area
Average Home Value in this Area
Purchase History
| Date | Buyer | Sale Price | Title Company |
|---|---|---|---|
| Cade Beverly C | -- | Title Partners Agency Llc | |
| Cade Beverly C | -- | Title Partners | |
| Spight Beverly C | -- | -- |
Source: Public Records
Mortgage History
| Date | Status | Borrower | Loan Amount |
|---|---|---|---|
| Open | Cade Beverly C | $71,250 | |
| Closed | Cade Beverly C | $71,250 | |
| Previous Owner | Spight Beverly C | $66,000 |
Source: Public Records
Tax History Compared to Growth
Tax History
| Year | Tax Paid | Tax Assessment Tax Assessment Total Assessment is a certain percentage of the fair market value that is determined by local assessors to be the total taxable value of land and additions on the property. | Land | Improvement |
|---|---|---|---|---|
| 2025 | $2,292 | $22,100 | $1,920 | $20,180 |
| 2024 | $2,292 | $21,870 | $1,160 | $20,710 |
| 2023 | $2,292 | $21,870 | $1,160 | $20,710 |
| 2022 | $2,285 | $17,610 | $2,680 | $14,930 |
| 2021 | $2,275 | $17,610 | $2,680 | $14,930 |
| 2020 | $1,778 | $15,320 | $1,940 | $13,380 |
| 2019 | $1,751 | $15,320 | $1,940 | $13,380 |
| 2018 | $1,612 | $13,390 | $890 | $12,500 |
| 2017 | $1,594 | $13,390 | $890 | $12,500 |
| 2016 | $1,540 | $13,060 | $1,620 | $11,440 |
| 2015 | $1,481 | $13,060 | $1,620 | $11,440 |
| 2014 | $1,320 | $11,640 | $2,390 | $9,250 |
Source: Public Records
Map
Nearby Homes
- 2 Capitol Hill Dr
- 2283 Hudson Rd
- 2209 Kipp Ct
- 10243 Pannell Dr
- 10342 Edgefield Dr
- 10421 Monarch Dr
- 10216 Pannell Dr
- 2353 Hallwood Dr
- 10216 Viscount Dr
- 10401 Baron Dr
- 10562 Murat Dr
- 62 Capitol Hill Dr
- 10205 Northland Hills Ct
- 10246 Dacey Dr
- 10216 Green Valley Dr
- 10230 Green Valley Dr
- 2131 Old Manor Rd
- 10208 Monarch Dr
- 10175 Cloverdale Dr
- 10246 Green Valley Dr
- 2215 Foss Ct
- 2225 Foss Ct
- 2214 Ibis Ct
- 2209 Foss Ct
- 2218 Ibis Ct
- 2208 Ibis Ct
- 2220 Foss Ct
- 10433 Hallwood Dr
- 10437 Hallwood Dr
- 2214 Foss Ct
- 10427 Hallwood Dr
- 10418 Halls Ferry Rd
- 2208 Foss Ct
- 10441 Hallwood Dr
- 10421 Hallwood Dr
- 10428 Halls Ferry Rd
- 2219 Ibis Ct
- 10408 Halls Ferry Rd
- 2221 Hudson Rd
- 2215 Hudson Rd